Evidence as of 26 October 2026 · prices checked 21 October 2026
How we check that Errorbar's numbers are right
A statistics program prints a wrong P value with the same confidence as a right one, so accuracy has to be shown, not claimed. We tested Errorbar against certified reference values and against R, and we check that every result can be reproduced in R by anyone who doubts it.
- 3,350test problems across 20 analyses, scored against values known to be correct
- 0problems where Errorbar was less accurate than R or SciPy
- 25 of 25certified NIST curve fits solved from both starting points (R's defaults: 15 and 23)
- 617 of 617numbers from Errorbar's exported R scripts that match Errorbar when run in R
1. Accuracy against certified values
We ran 3,350 problems through Errorbar, R 4.3.3 and SciPy/statsmodels. 96 come from the NIST Statistical Reference Datasets, which publish certified answers to 15 significant digits. 15 are stress problems aimed at known weak points. 3,239 are simulated across 20 analyses at five data scales; for these we computed the correct answer independently at 60 significant digits, so neither R nor SciPy is treated as the truth. Accuracy is the number of correct significant digits (the log relative error; McCullough, 1998). Results are reported to at most 4 significant figures, so we treat 6 correct digits as agreement.
On ordinary lab data, all three programs agree to far more digits than anyone reports. The differences appear on numerically hard data, and there Errorbar keeps its accuracy while R and SciPy lose most of theirs.
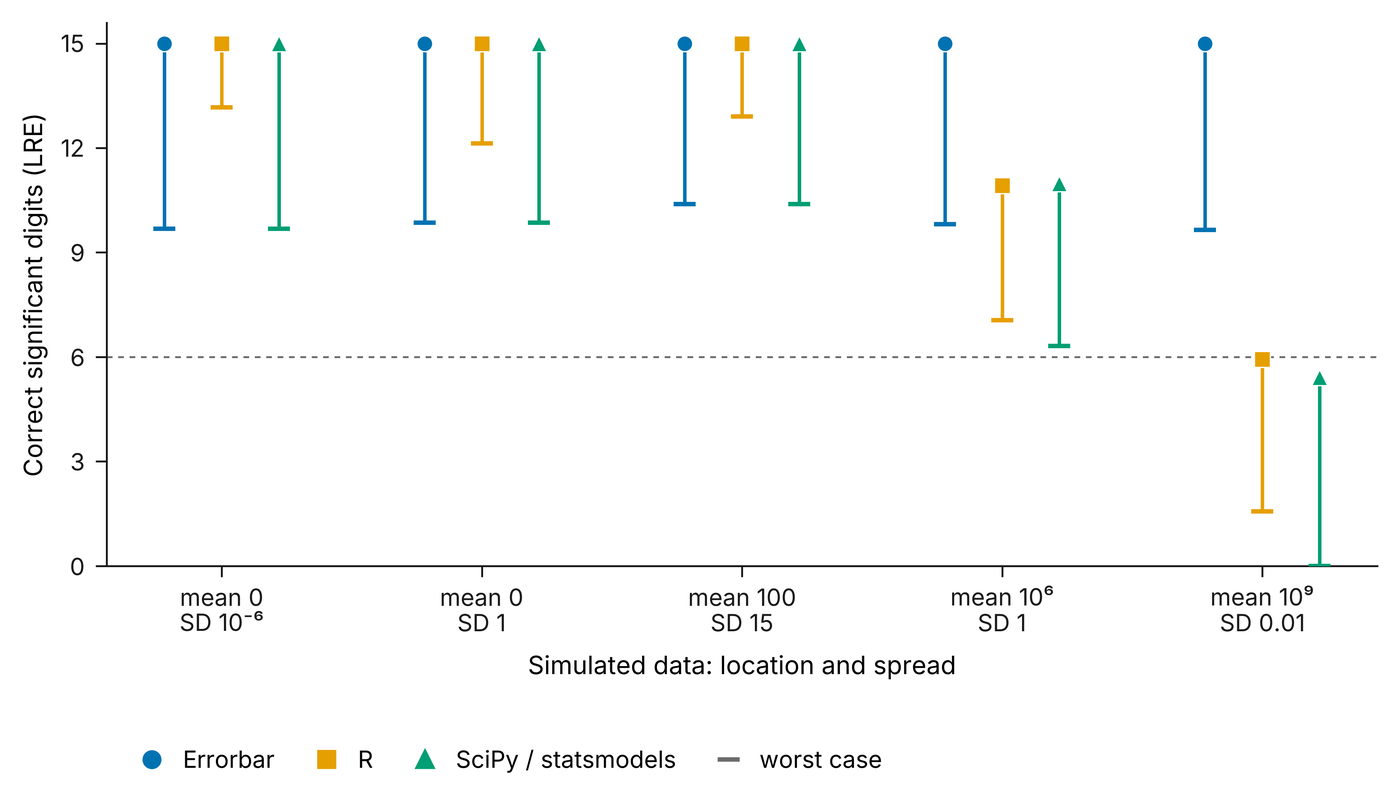
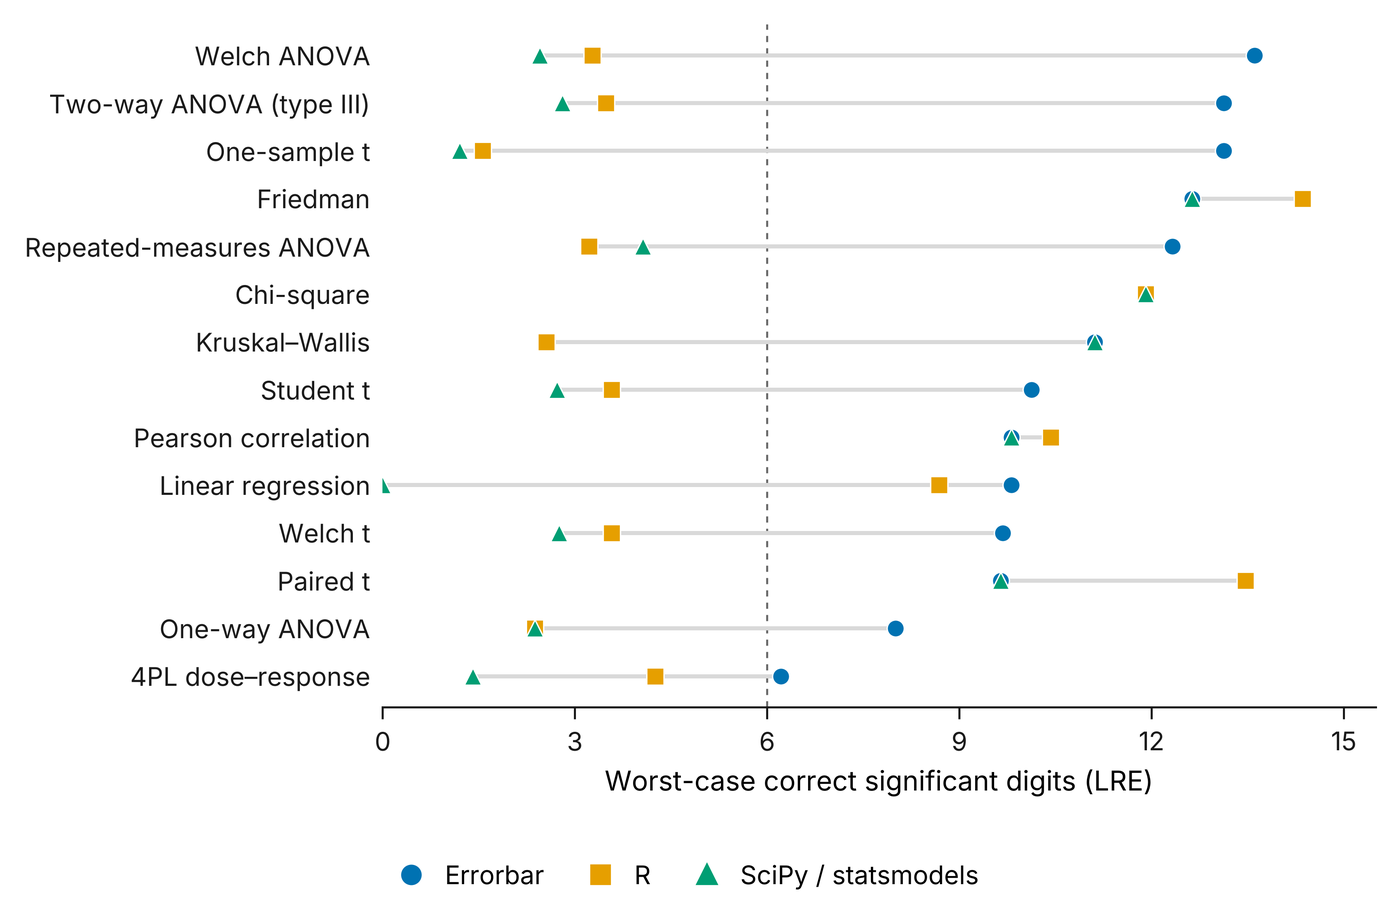
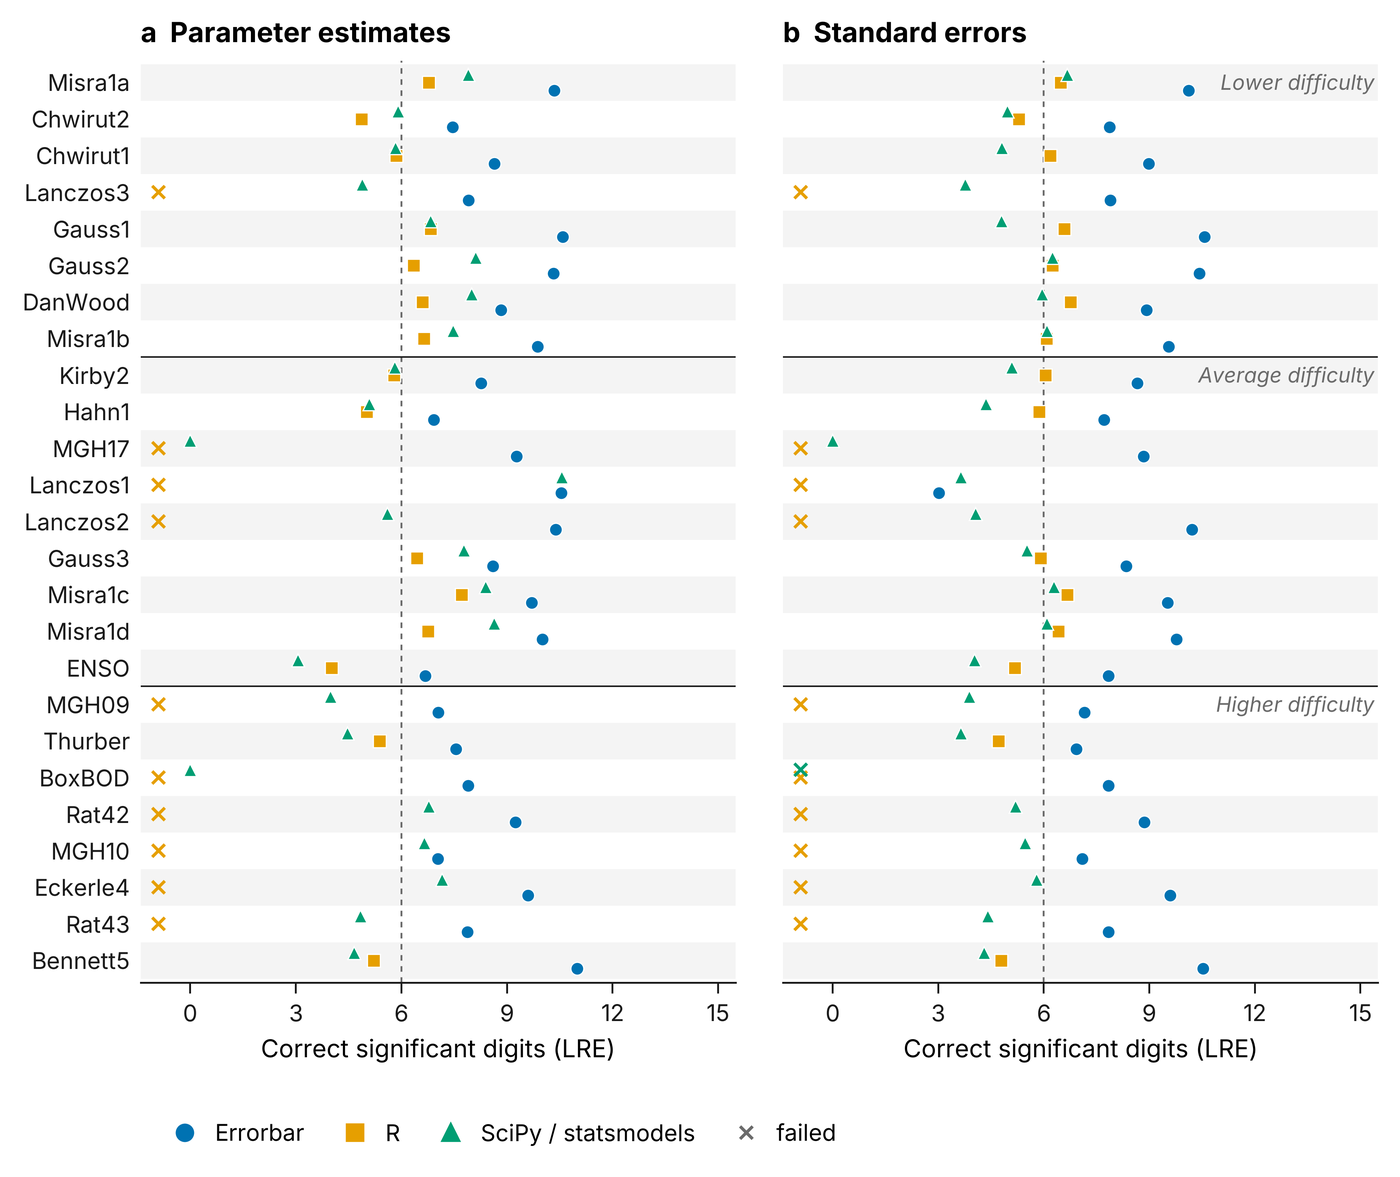
nls with default settings failed on 10 problems from the first start and 2 from the second. Given no starting values at all, Errorbar's automatic starts found the certified answer on 24 of 25. On the other, ENSO, it stopped at a different minimum and asked the user to check the curve and enter starting values.
2. Every result can be re-run in R
Each result in Errorbar has an Export R script button. The script reads the project's own data files and runs the same analysis in R, so a reviewer, a supervisor or a statistician can check any number without trusting Errorbar.
We test that promise directly. An automated check builds 84 analysis set-ups covering all 33 analysis types that write R, plus 9 assay set-ups (qPCR, ELISA, enzyme kinetics) and 3 Western blots. It runs each one in Errorbar, runs the exported script in R, and compares the results: 617 numbers, from P values and confidence limits to EC50s and fold changes, with no mismatches. It also checks that each of the 37 curve-fitting models is written in R with exactly the same formula Errorbar fits.
Two things cannot be reproduced exactly, and the exported script says so: the ROUT outlier method, which has no R implementation, and bootstrap confidence intervals, which depend on random resampling.
3. Where Errorbar and R differ, and why
Every difference larger than 6 digits between Errorbar and R or SciPy was traced to a cause; none was left unexplained. Apart from cases where the other program was less accurate or refused to answer, four conventions account for all of them. Each is a choice between defensible methods, not an error on either side.
- Spearman P for small samples. Errorbar follows R: the exact distribution up to 9 pairs without ties, then the AS 89 series up to 1,290 pairs; SciPy uses the t approximation.
- Tukey adjusted P values. R's
ptukeyis documented to about 4 decimal places; Errorbar matches the 60-digit value. - Mann-Whitney P for small samples. SciPy switches to an exact P; Errorbar uses the normal approximation with continuity correction, as R does when there are ties.
- Wilcoxon signed-rank with zero differences. Errorbar follows R.
4. What this evidence does not show
- We compared Errorbar with R and SciPy only. We did not test other commercial packages: Errorbar is built clean-room, and we do not run or inspect them.
- R and SciPy ran with default settings, as most people run them. With tuned settings, R's
nlsconverges on more NIST problems. - The benchmark covers 20 analyses. Mixed models, estimated marginal means and competing-risks methods were checked separately against R.
- Accuracy is not appropriateness. These results show that Errorbar computes the chosen test correctly, not that the test suits the experiment. Errorbar's guidance on choosing tests is a separate matter.
- The benchmark results are for Errorbar as of 26 October 2026 (main f5acd79 with a fix for very large contingency tables). Any change to the statistics code means running it again, which takes one command.
5. What it costs
Errorbar is free during the beta. These prices apply from the paid launch.
| Plan | Price | What it covers |
|---|---|---|
| Lab | $1,000 a year | Up to 10 people, then $100 a year for each extra person |
| Student | $24.99 the first year, then $49.99 | One student, verified by a university email address |
| Trial | Free for 14 days | Everything, with no card needed |
| Viewer | Free | Opens, displays and exports every project. Used when a trial or licence ends: nothing is deleted or locked away. |
Prices for individual academics and industry will be published before the paid launch.
Your data stays on your computer. The statistics run inside your browser, and projects are kept in the browser and in files you save. The only thing Errorbar sends is feedback you write and choose to send, and that never includes your tables, file names or figures.
6. Check it yourself
- Export the R script from any result and run it: the numbers should match to the digits shown.
- Every analysis records a fingerprint of its data, its settings and the engine version in the project's history, so a result can be traced back to the data that produced it.