
Lab For the whole lab
$1,000a year for up to 10 people
- $100 a year for each extra person
- Everything in Errorbar for every member
- Groups over 25 people move to department pricing
Statistics and graphs for biology labs · free during the beta
58,166 results checked against R, with every difference explained.
Errorbar is statistics and graphing for the bench. Paste your data, get the right test with a plain-language answer, and make a figure a journal will take. Any result can be re-run in R by anyone who wants to check it.
What it does
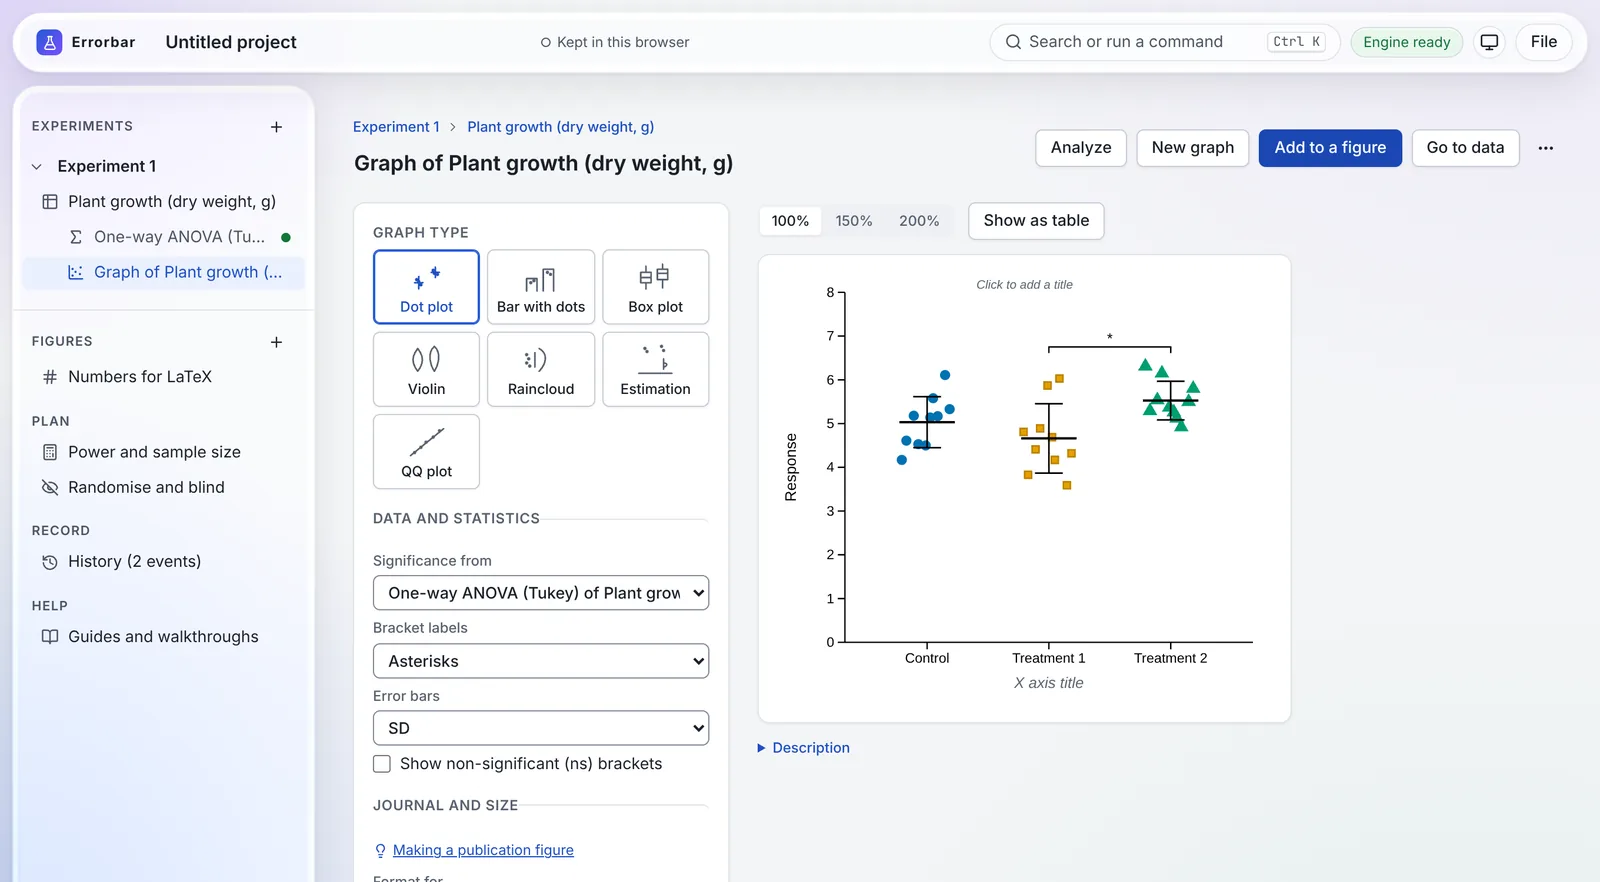
Describe your experiment in a few questions. Errorbar suggests the analysis, lays out the table, and the guides explain why.
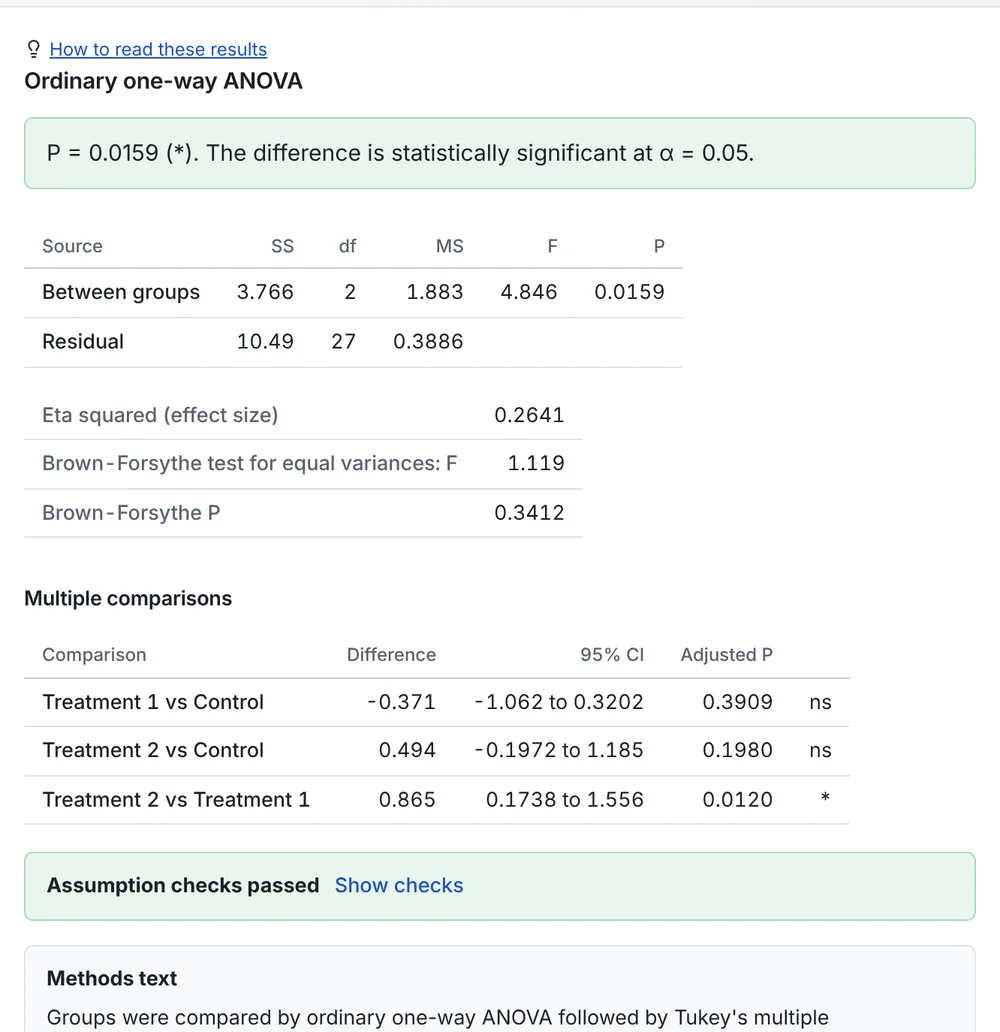
Each result opens with one sentence you can say at lab meeting, then the tables, effect sizes, assumption checks and a methods paragraph.
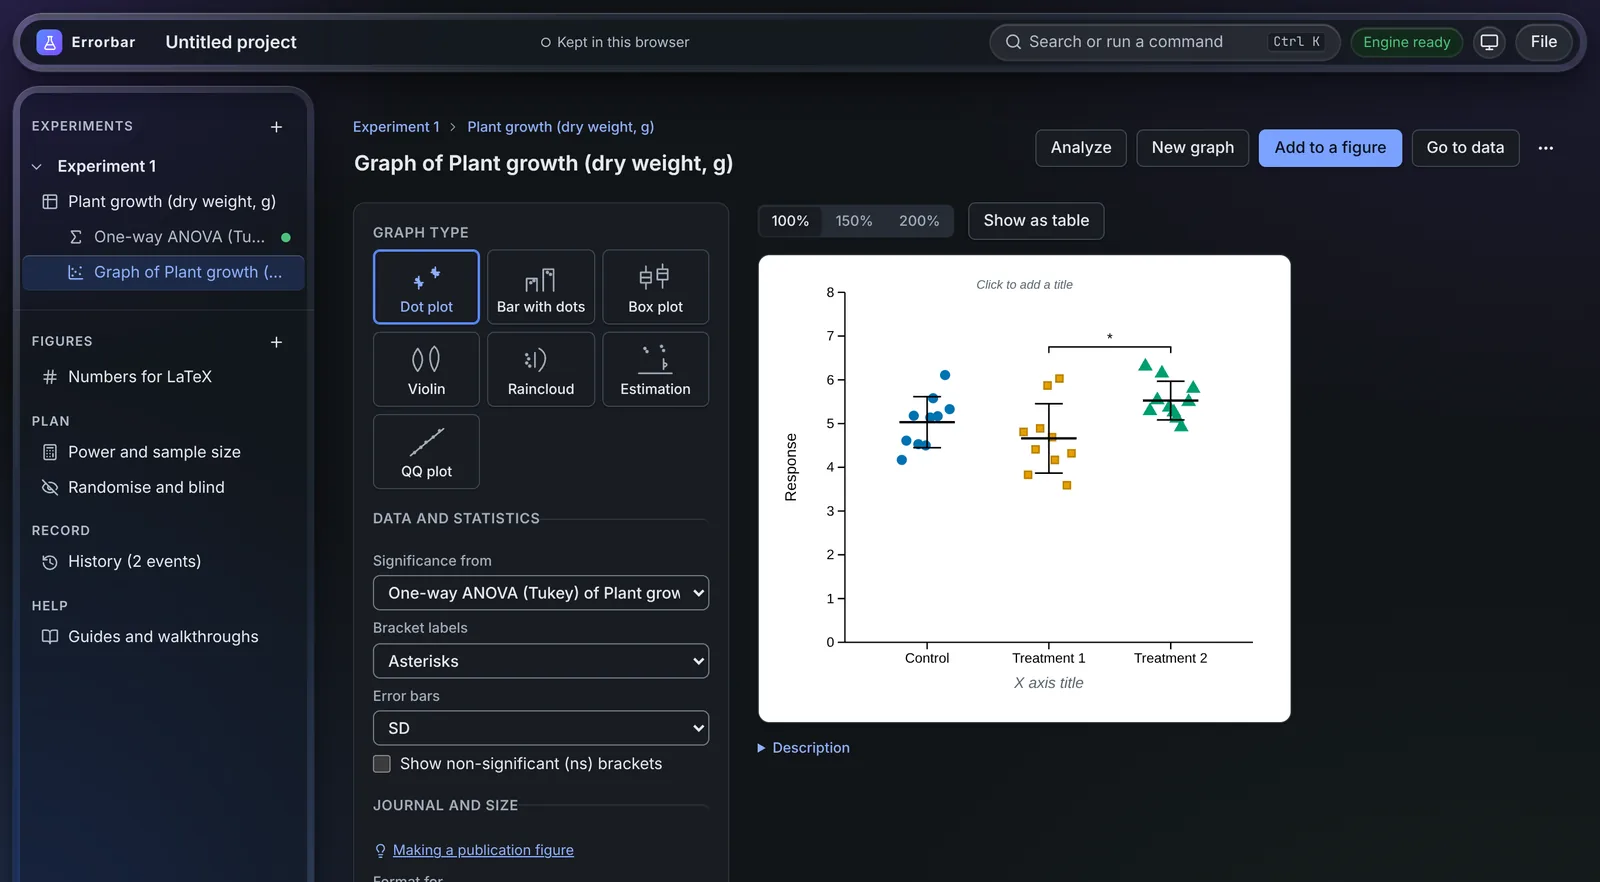
Dot, bar-with-dots, box, violin, raincloud and estimation plots, sized for the journal, in colour-blind-safe palettes. Build multi-panel figures in the figure composer.
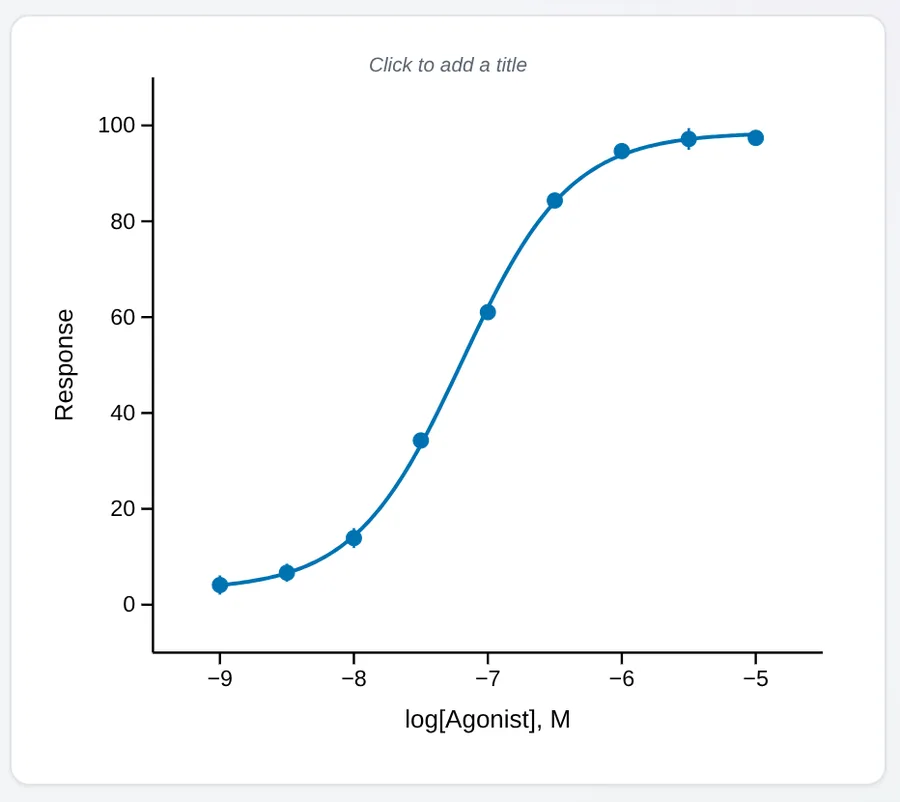
Dose-response and 36 other curve models with EC50s and confidence bands. ELISA standard curves, qPCR and enzyme kinetics, and densitometry from Western blot images.
Cells from several mice? Nested and mixed models keep technical replicates from inflating your n, and SuperPlots show both levels.
Work out sample size and power, then randomise and blind your groups with a sealed key that checks itself when you unblind.
Export an R script from a result and run it yourself. The history records the data, settings and engine version behind every number.
Paste from Excel, or open CSV, .pzfx, .rds and .RData files. A whole project saves as one file you can send to a labmate.
Also included: t tests, one-way, two-way and repeated-measures ANOVA, nonparametric tests, contingency tables, correlation and regression, Kaplan–Meier survival and competing risks, equivalence tests, numbers for LaTeX, and Python code cells.
How we check the numbers
A wrong P value prints with the same confidence as a right one, so accuracy has to be shown. We compared Errorbar’s results with R one value at a time, scored them against certified NIST answers and independent 60-digit calculations, and traced every difference to its cause.
For each core analysis, the fewest correct digits each program got across 10,248 results from 2,588 test problems, scored against answers computed to 60 digits. Further right is better.
| Analysis | Errorbar | R | SciPy |
|---|---|---|---|
| One-sample t test | 13.1 | 1.6 | 1.2 |
| Welch's ANOVA | 13.6 | 3.3 | 2.5 |
| Two-way ANOVA | 13.1 | 3.5 | 2.8 |
| Repeated-measures ANOVA | 12.3 | 3.2 | 4.1 |
| Kruskal-Wallis test | 11.1 | 2.6 | 11.1 |
| Unpaired t test | 10.1 | 3.6 | 2.7 |
| Welch's t test | 9.7 | 3.6 | 2.8 |
| One-way ANOVA | 8.0 | 2.4 | 2.4 |
| 4PL dose-response fit | 6.2 | 4.3 | 1.4 |
| Linear regression | 9.8 | 8.7 | 0.0 |
| Chi-square test | 11.9 | 11.9 | 11.9 |
| Pearson correlation | 9.8 | 10.4 | 9.8 |
| Friedman test | 12.6 | 14.4 | 12.6 |
| Paired t test | 9.7 | 13.5 | 9.7 |
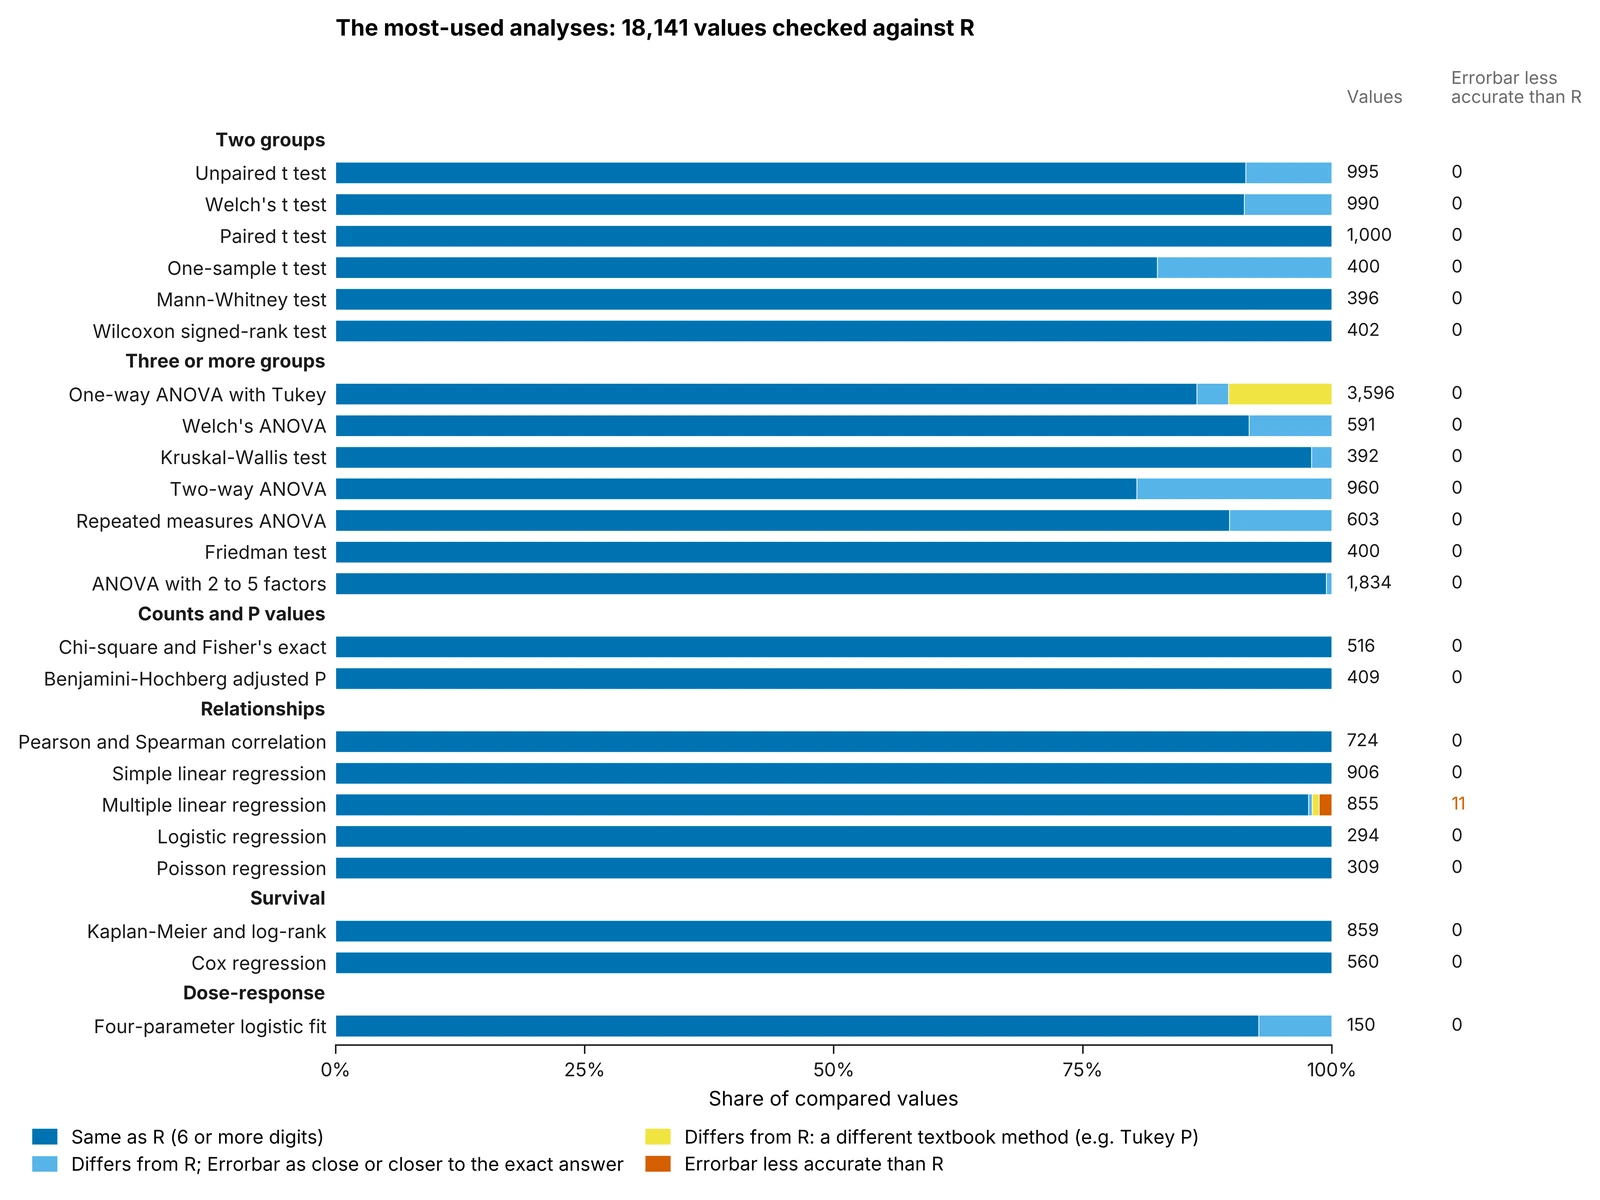
18,141 values from 23 analyses. Dark blue: the same answer as R. Light blue: a different answer, with Errorbar as close or closer to the exact answer. Yellow: the two programs use different textbook methods. Orange: Errorbar less accurate.
| Analysis | Values | Same as R | Errorbar as close or closer to the exact answer | Different textbook method | Errorbar less accurate than R |
|---|---|---|---|---|---|
| Two groups | |||||
| Unpaired t test | 995 | 909 | 86 | 0 | 0 |
| Welch's t test | 990 | 903 | 87 | 0 | 0 |
| Paired t test | 1,000 | 1,000 | 0 | 0 | 0 |
| One-sample t test | 400 | 330 | 70 | 0 | 0 |
| Mann-Whitney test | 396 | 396 | 0 | 0 | 0 |
| Wilcoxon signed-rank test | 402 | 402 | 0 | 0 | 0 |
| Three or more groups | |||||
| One-way ANOVA with Tukey | 3,596 | 3,109 | 114 | 373 | 0 |
| Welch's ANOVA | 591 | 542 | 49 | 0 | 0 |
| Kruskal-Wallis test | 392 | 384 | 8 | 0 | 0 |
| Two-way ANOVA | 960 | 772 | 188 | 0 | 0 |
| Repeated measures ANOVA | 603 | 541 | 62 | 0 | 0 |
| Friedman test | 400 | 400 | 0 | 0 | 0 |
| ANOVA with 2 to 5 factors | 1,834 | 1,824 | 10 | 0 | 0 |
| Counts and P values | |||||
| Chi-square and Fisher's exact | 516 | 516 | 0 | 0 | 0 |
| Benjamini-Hochberg adjusted P | 409 | 409 | 0 | 0 | 0 |
| Relationships | |||||
| Pearson and Spearman correlation | 724 | 724 | 0 | 0 | 0 |
| Simple linear regression | 906 | 906 | 0 | 0 | 0 |
| Multiple linear regression | 855 | 835 | 3 | 6 | 11 |
| Logistic regression | 294 | 294 | 0 | 0 | 0 |
| Poisson regression | 309 | 309 | 0 | 0 | 0 |
| Survival | |||||
| Kaplan-Meier and log-rank | 859 | 859 | 0 | 0 | 0 |
| Cox regression | 560 | 560 | 0 | 0 | 0 |
| Dose-response | |||||
| Four-parameter logistic fit | 150 | 139 | 11 | 0 | 0 |
| All 23 analyses | 18,141 | 17,063 | 688 | 379 | 11 |
108 dataset and analysis pairs from the NIST Statistical Reference Datasets. Each point shows the fewest correct digits each program got on that dataset.
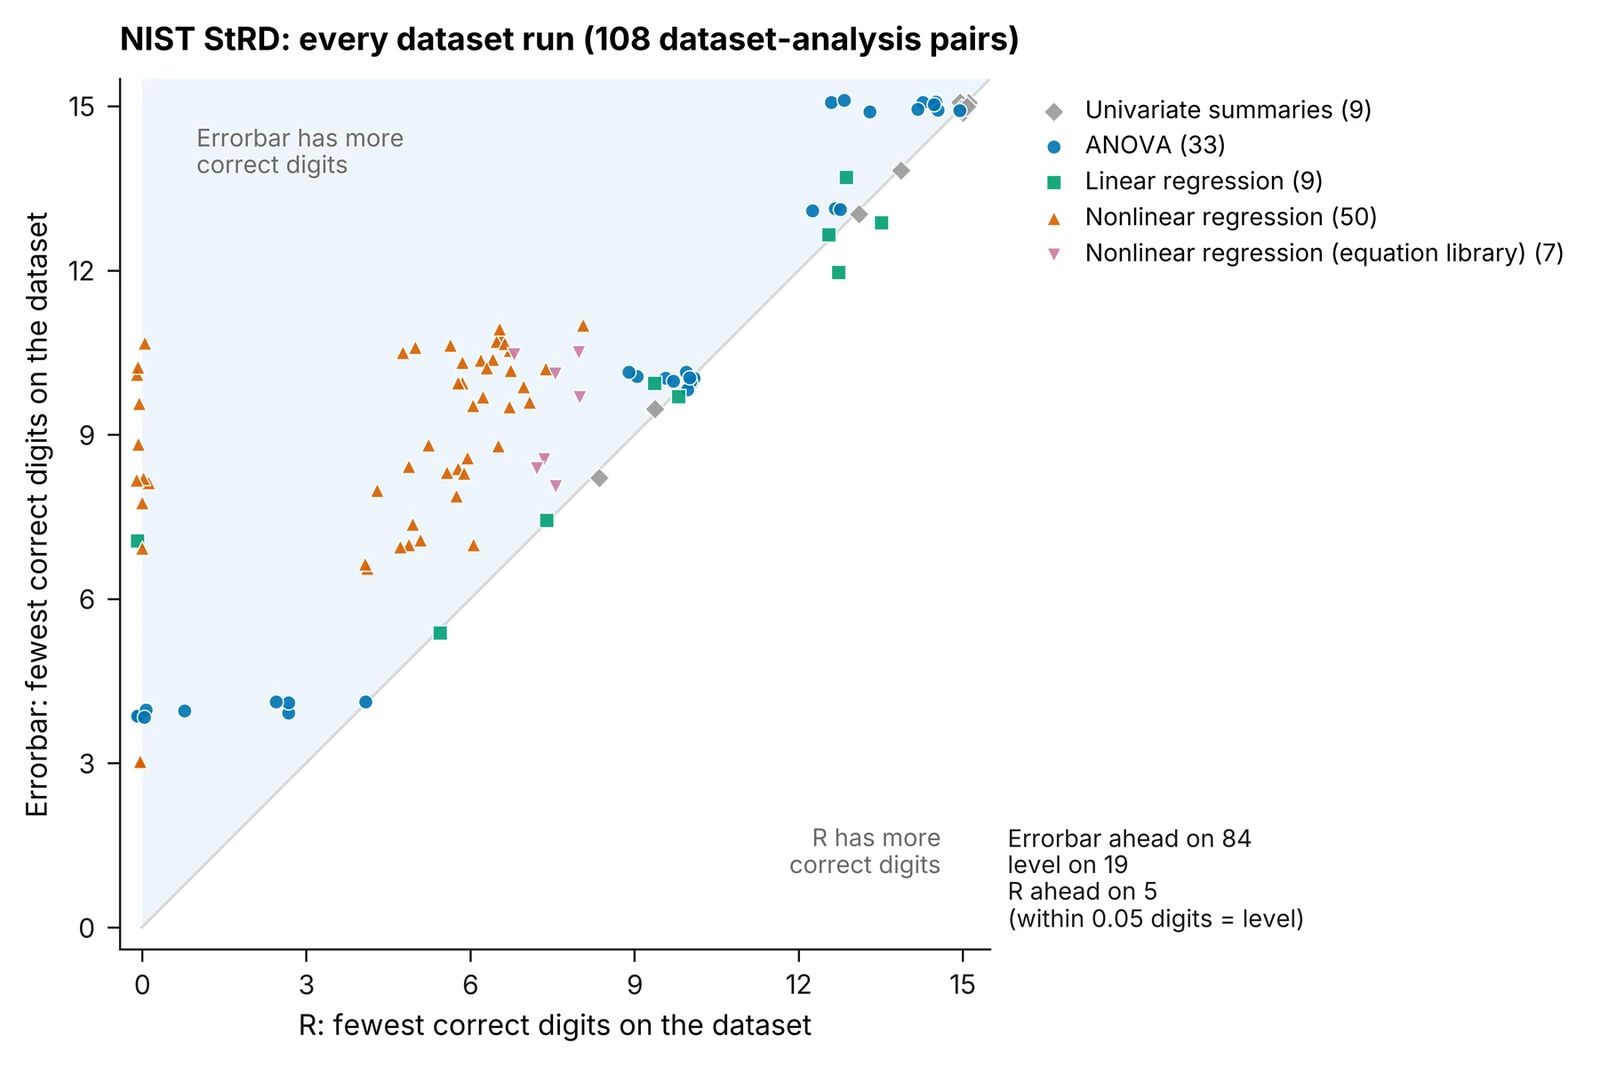
R and SciPy ran with their default settings, as most people run them. Benchmarks of Errorbar as of 26 October 2026, run in the browser as users run it, against R 4.3.3, SciPy 1.14.1, NIST certified values and 60-digit calculations. Accuracy is not appropriateness: these results show that Errorbar computes the chosen test correctly, not that the test suits the experiment.
Read the full accuracy reportThe method, all eight figures, and every difference from R explained.
Made for the whole lab
The statistics run inside your browser. Projects are kept in the browser and in files you save, so unpublished data never sits on our servers.
Every screen works from the keyboard and is labelled for screen readers. Palettes stay distinct for colour-blind readers, and the glass effects step aside when you ask for less transparency.
Use a current Chrome, Edge, Firefox or Safari on Windows, Mac or Linux. The first visit downloads the statistics engine, about 65 MB.
Pricing
Errorbar is free during the beta. These prices start when paid plans launch.
$1,000a year for up to 10 people
$24.99the first year, then $49.99 a year
14 daysfree, with no card needed
Freefor as long as you need it
Prices for individual academics and for industry will be published before paid plans launch. Prices in US dollars.
Questions
No. Errorbar’s statistics engine runs inside your browser, so your data is analysed on your own computer. Projects are kept in your browser and in the project files you choose to save.
Yes. Paste straight from Excel, or open CSV, .pzfx, .rds and .RData files. Western blot and microscope images open as TIFF, PNG or JPEG.
Every analysis is tested against R and certified reference values. The accuracy report publishes the results, including where Errorbar falls short. You can also export an R script from any result and run it yourself.
Errorbar becomes the free Viewer. You can still open, read and export every project. Nothing is deleted or locked.
Yes. The Lab plan covers up to 10 people for $1,000 a year, and each extra person is $100 a year. Groups over 25 people move to department pricing.
No. Errorbar runs in a current browser. Open it, and the statistics engine loads on the first visit.