
Technical report · numerical accuracy
How accurate is Errorbar?
Errorbar’s results against R, SciPy, the NIST Statistical Reference Datasets and answers computed in 60-digit arithmetic: how we tested, what we found, and every place Errorbar falls short.
Summary
A statistics program prints a wrong P value with the same confidence as a right one, so its accuracy has to be measured and published. We ran Errorbar’s statistics engine in the browser, exactly as users run it, and compared it with R 4.3.3, with SciPy and statsmodels, with the certified values of the NIST Statistical Reference Datasets, and with answers computed independently in 60-digit arithmetic. Every value on which Errorbar and R disagreed was traced to a cause.
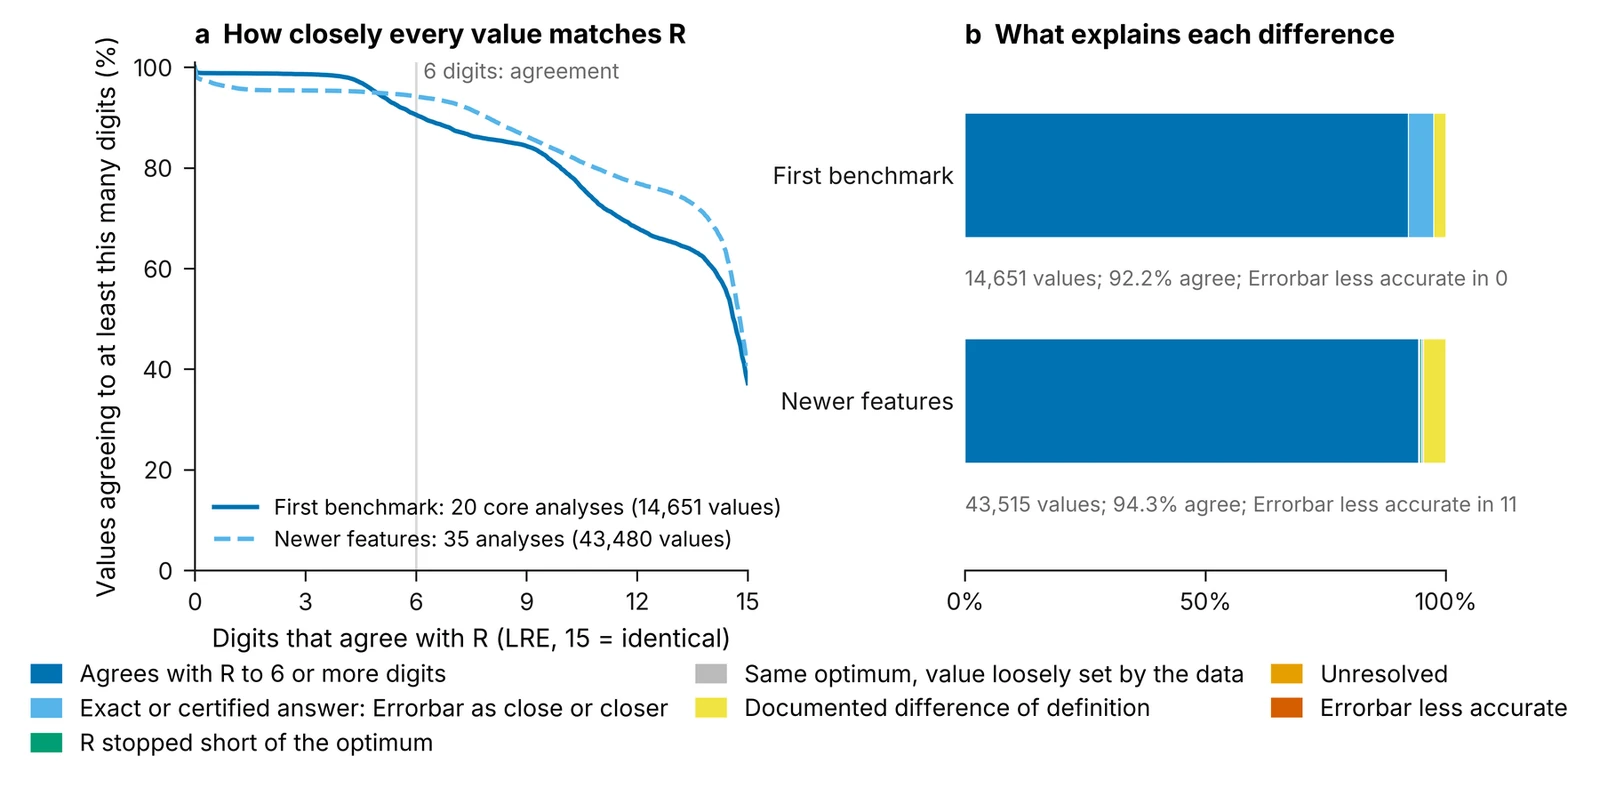
- 58,166 results from 55 analyses were compared with R value by value, in two benchmarks.
- Core analyses: on 3,350 problems over 20 analyses there was no problem on which Errorbar was less accurate than R or SciPy.
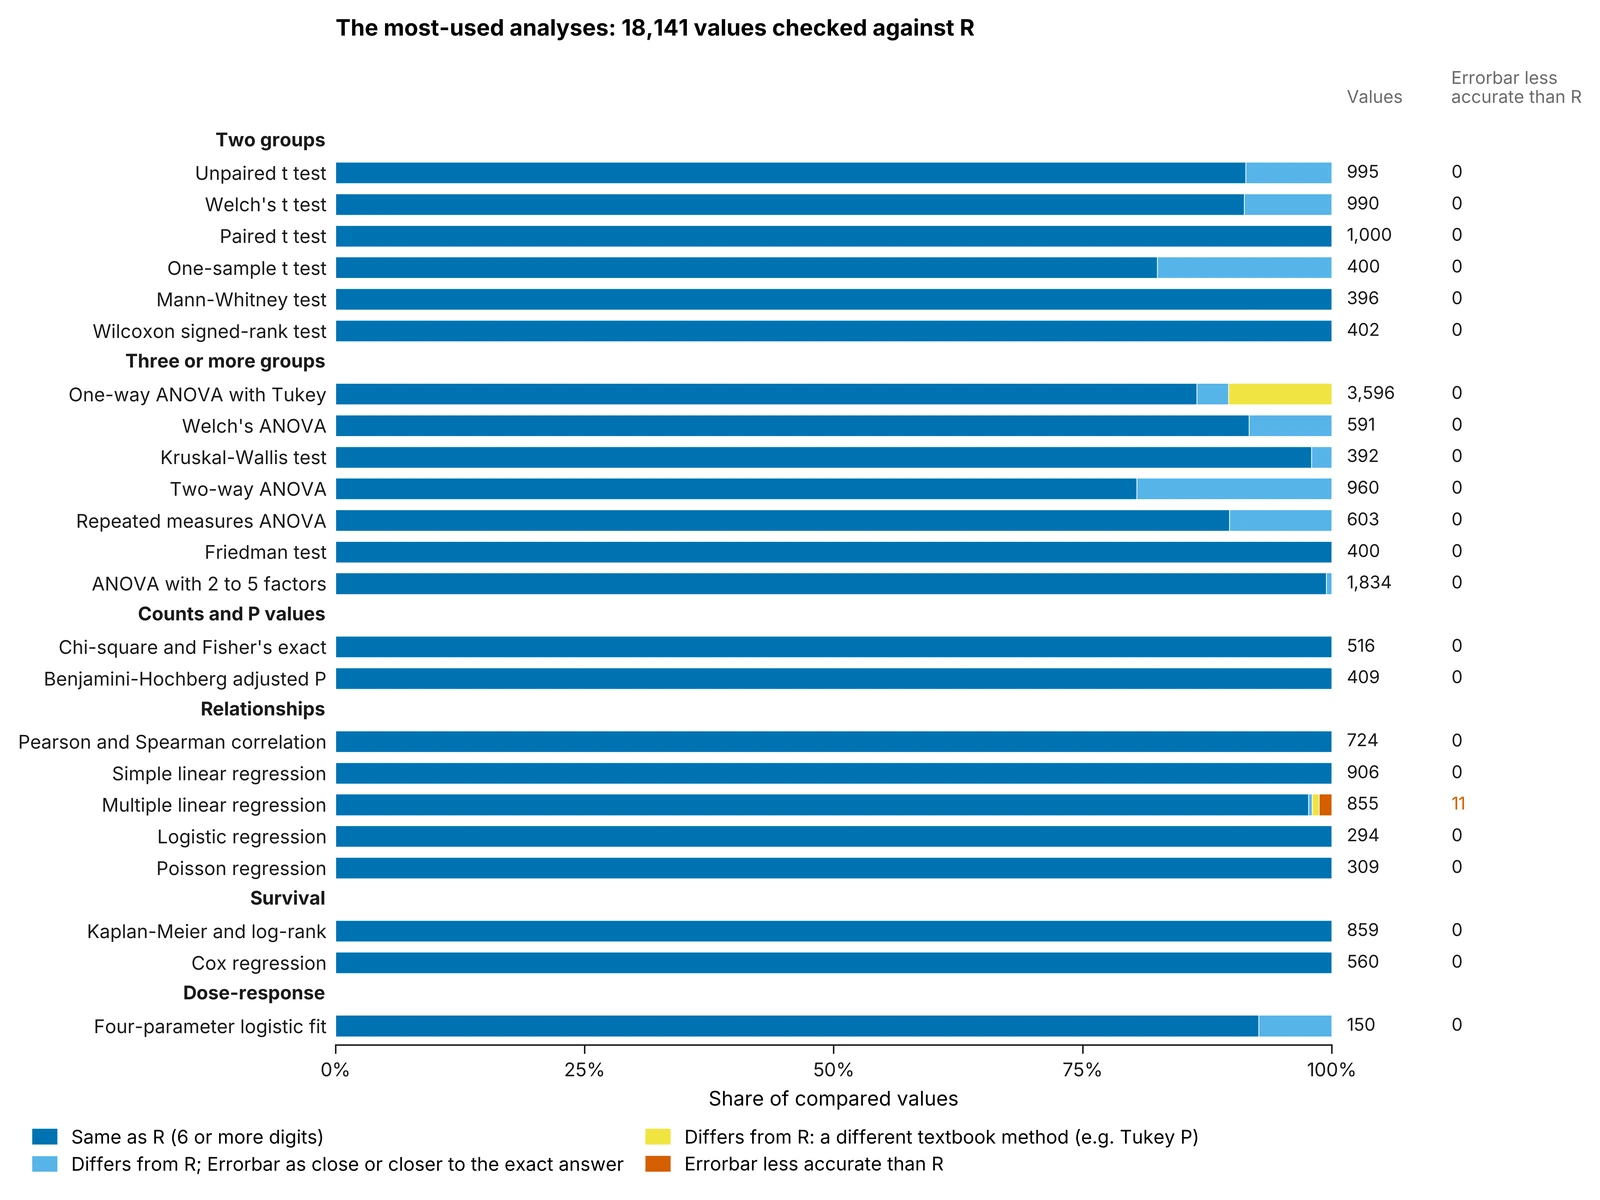
- The 23 tests labs use most: of 18,141 values, 17,063 give the same answer as R to six or more significant digits. Every other value has a known cause: in 688 Errorbar was as close or closer to the exact answer, and 379 come from the two programs using different textbook methods.
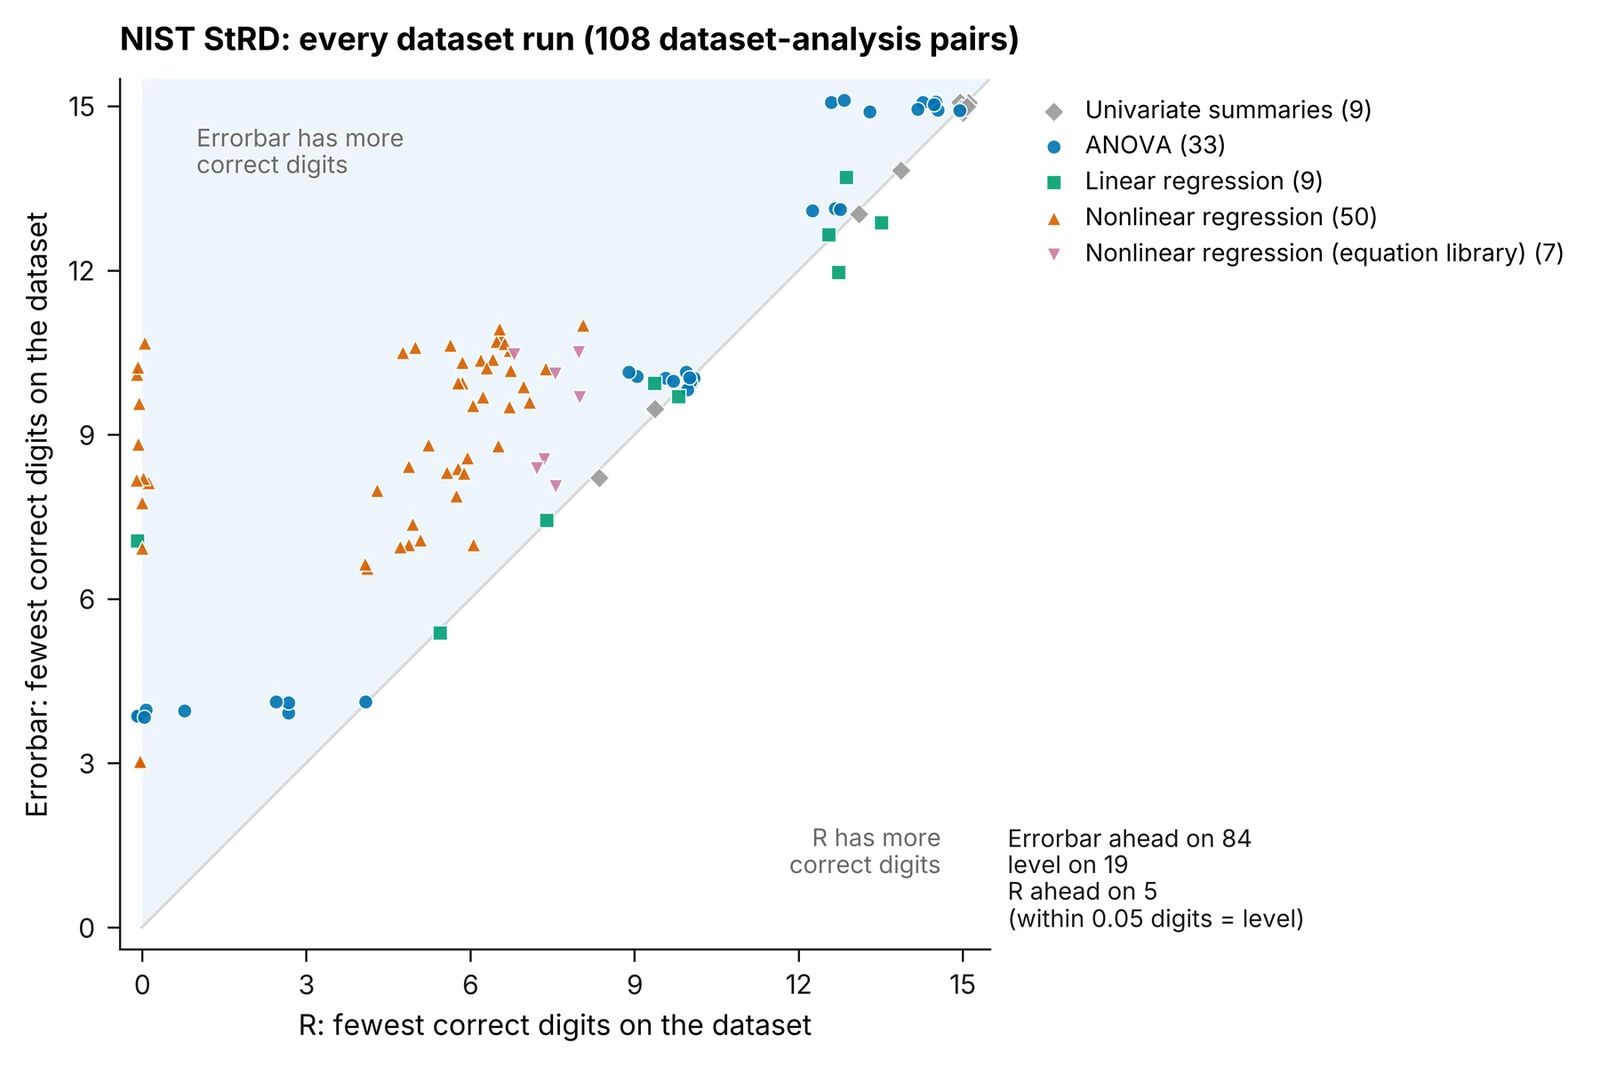
- NIST certified data: on 108 dataset and analysis pairs, Errorbar had more correct digits than R on 84, the same on 19, and fewer on 5. It solved all 25 nonlinear regression problems from both certified starting points.
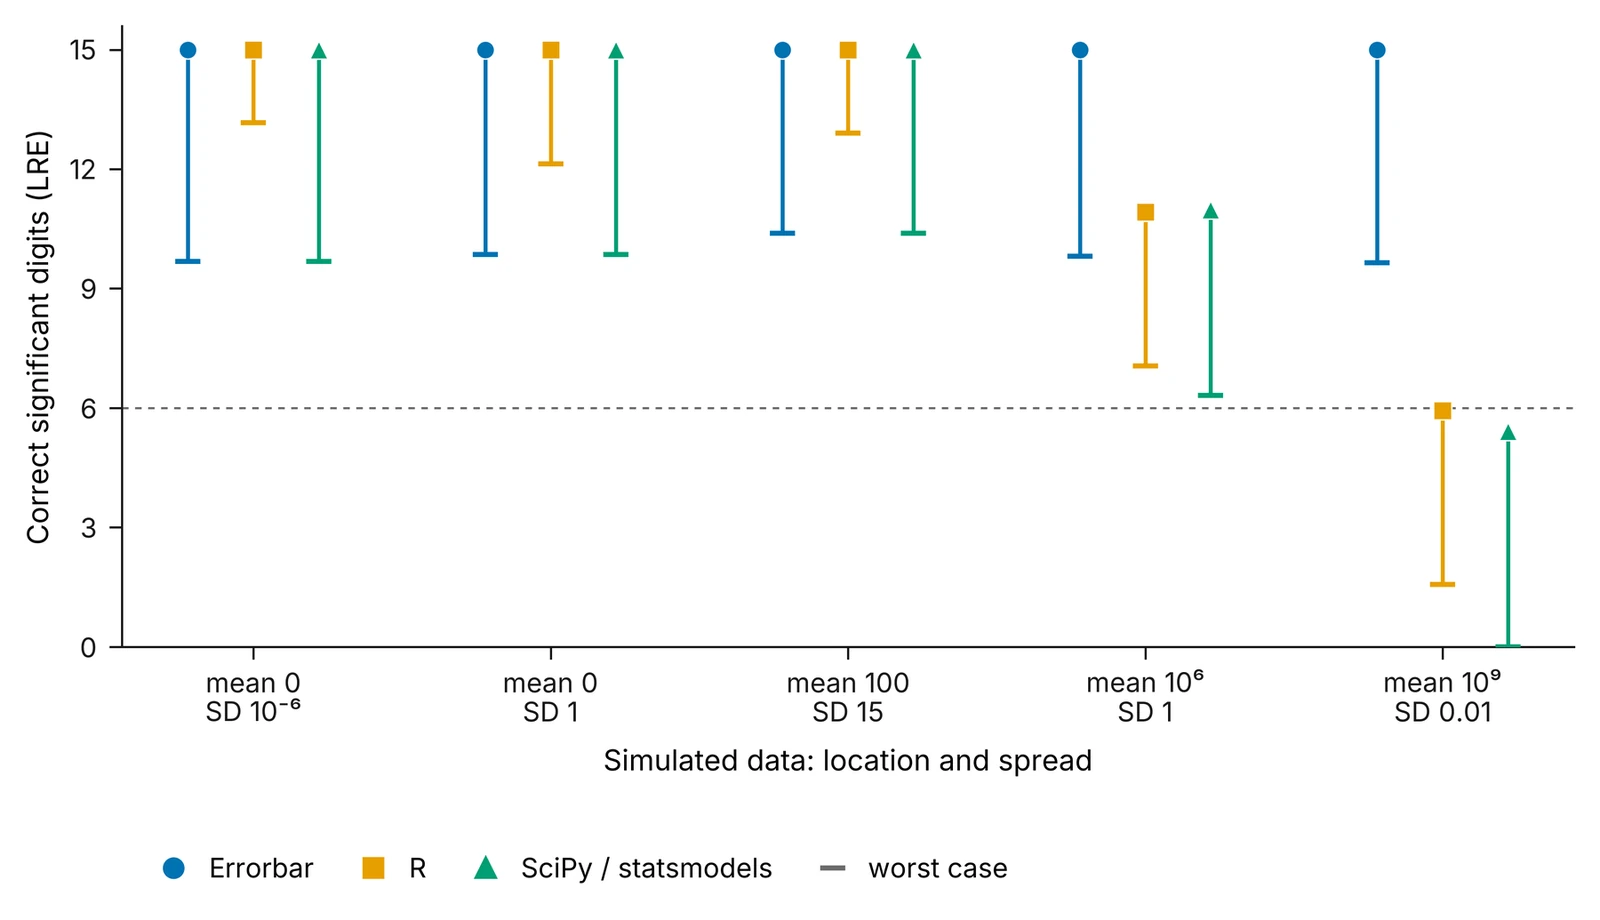
- Hard data: on data sharing nine leading digits, Errorbar kept at least 9.7 correct digits; R with default settings kept 1.6 and SciPy none.
- Where Errorbar was the less accurate program: 11 values, all rounding residue below 2.2 × 10⁻¹⁰ on two NIST problems whose certified answer is exactly zero. Section 7 lists these and every other weakness we found.
Agreeing with R is not the same as being accurate. When we say a value “agrees with R”, we mean the two programs printed the same number to at least six significant digits. When they don’t, that is not an error by Errorbar: often R is the one further from the true answer, or the two programs use different textbook methods for the same quantity. So a figure such as “93% of values agree with R” is not a 93% accuracy score. What measures Errorbar’s mistakes is how often it was the less accurate program: 11 values out of 58,166, all rounding residue on problems whose true answer is zero.
This is a technical report from the makers of Errorbar. It has not been peer reviewed. Every number in it comes from result files kept with Errorbar’s source, and nothing has been rounded in Errorbar’s favour.
1. How we tested
The software under test
Errorbar’s statistics engine is written in Python on NumPy, SciPy and statsmodels and runs inside the web browser as WebAssembly, through Pyodide 0.27.7, so data never leave the user’s computer. All headline results come from that engine running in headless Chromium inside the app’s own background worker, as of 26 October 2026. The same engine was also run under native Python with the same library versions, to separate effects of the browser build from effects of the code. Errorbar’s analyses are its own implementations. It contains no R code, and R is used only to produce reference numbers.
What we compared it with
- R 4.3.3 with its recommended packages and the contributed packages each analysis needs (survival, car, emmeans, lme4, geepack, glmnet, minpack.lm, cmprsk and others), run with default settings. R is the reference most statisticians accept, so it is the main comparison.
- SciPy 1.14.1 and statsmodels 0.14.4, a second implementation for the first benchmark. Because Errorbar is built on these libraries, agreement with them is not independent evidence; R and the exact answers carry the comparison.
- NIST certified values for every Statistical Reference Dataset used [6].
- Exact answers computed with mpmath [12] in 60 significant digits from the same input data, and in 20 to 60 digits wherever a second referee was needed.
Counting correct digits
Accuracy is measured as the log relative error (LRE), the number of leading significant digits on which a value and its reference agree [1]:
LRE = −log₁₀(|x − c| / |c|), or −log₁₀|x| when the reference c is 0
It is capped at 15, about the precision of a double, or at the number of digits a certified value carries, and floored at 0. Two programs agree on a value when their LRE against each other is 6 or more. Methods that are random by design (random forests, t-SNE, UMAP, Monte Carlo simulation) cannot match digit for digit, so they were judged against R’s own spread over repeated runs.
The two benchmarks
The first benchmark covered 20 core analyses: descriptive statistics; one-sample, unpaired, Welch and paired t tests; one-way ANOVA with Tukey’s comparisons; Welch’s ANOVA; two-way and repeated-measures ANOVA; the Mann-Whitney, Wilcoxon signed-rank, Kruskal-Wallis and Friedman tests; chi-square and Fisher’s exact tests; Pearson and Spearman correlation; simple linear regression; Kaplan-Meier survival with the log-rank test; Benjamini-Hochberg adjusted P values; and nonlinear regression, including the four-parameter logistic dose-response curve. It held 3,350 problems: 96 from NIST, 15 stress problems built to be numerically hard, and 3,239 random datasets from a fixed seed.
The second benchmark covered 35 analyses added later: multiple, logistic, Poisson and negative binomial regression; ANOVA with two to five factors; mixed models and generalised estimating equations; Cox regression with time-varying covariates; agreement statistics; Bayesian t tests and ANOVA; 95 curve-fitting models, global fits and smoothing splines; principal components, PLS-DA, clustered heat maps, clustering and penalised regression; gradient boosting, random forests, t-SNE and UMAP; and power analysis and simulation. It held 1,069 cases and 43,515 compared values.
Explaining every difference
Each value on which Errorbar and R disagreed was given a cause by a fixed rule, in this order:
- Where a certified or exact answer exists, the program closer to it is the more accurate.
- For fits found by an optimiser (nonlinear regression, mixed models, clustering, penalised regression), the objective each program reached decides which stopped short. When both reached the same objective to 12 digits, the value is classed as loosely set by the data.
- Where the two programs compute a quantity by different published methods, the difference is a difference of definition: neither program is wrong, they answer by different textbook methods, and both are documented. For example, R approximates the Tukey P value (its documentation says to about four decimal places), while Errorbar computes it to full precision.
- Anything else is left unresolved and reported as such.
2. Every value against R
In the first benchmark 92.2% of 14,651 values agreed with R to six or more digits; in the second, 94.3% of 43,515, or 98.9% once differences of definition are set aside. As the note in the summary explains, the rest are not Errorbar’s errors: nearly all are values where R was the less accurate program, differences of definition, or values the data barely determine. Across both benchmarks Errorbar was the less accurate program on 11 values, 0.02% of all compared.
3. The tests labs use most
Table 1 and Figure 2 single out 23 analyses that make up most of the statistics in laboratory papers: 18,141 compared values. On 12 of them every value agrees with R to six or more digits. On the other 11, every difference is either R being further from an exact or certified answer, or a difference of definition, with one exception: 11 values of multiple regression, described in section 7.
Two differences of definition (different textbook methods) occur among these tests. Nearly all (373 of 379) are Tukey’s comparisons: R’s studentized range functions are approximations, which R documents as accurate to about four decimal places; Errorbar integrates the distribution numerically, and where far-tail Tukey P values were checked against high-precision values, Errorbar’s were the more accurate in all 10. The other six are in multiple regression: the F statistic, AIC and log-likelihood of exact fits (certified residual SD 0), which the two programs report as infinite by different conventions. Spearman P values agree with R throughout, because Errorbar chooses them as R does: exact for small samples without ties, then a published series approximation.
| Analysis | Values | Same as R | Errorbar as close or closer to the exact answer | Different textbook method | Errorbar less accurate than R |
|---|---|---|---|---|---|
| Two groups | |||||
| Unpaired t test | 995 | 909 | 86 | 0 | 0 |
| Welch's t test | 990 | 903 | 87 | 0 | 0 |
| Paired t test | 1,000 | 1,000 | 0 | 0 | 0 |
| One-sample t test | 400 | 330 | 70 | 0 | 0 |
| Mann-Whitney test | 396 | 396 | 0 | 0 | 0 |
| Wilcoxon signed-rank test | 402 | 402 | 0 | 0 | 0 |
| Three or more groups | |||||
| One-way ANOVA with Tukey | 3,596 | 3,109 | 114 | 373 | 0 |
| Welch's ANOVA | 591 | 542 | 49 | 0 | 0 |
| Kruskal-Wallis test | 392 | 384 | 8 | 0 | 0 |
| Two-way ANOVA | 960 | 772 | 188 | 0 | 0 |
| Repeated measures ANOVA | 603 | 541 | 62 | 0 | 0 |
| Friedman test | 400 | 400 | 0 | 0 | 0 |
| ANOVA with 2 to 5 factors | 1,834 | 1,824 | 10 | 0 | 0 |
| Counts and P values | |||||
| Chi-square and Fisher's exact | 516 | 516 | 0 | 0 | 0 |
| Benjamini-Hochberg adjusted P | 409 | 409 | 0 | 0 | 0 |
| Relationships | |||||
| Pearson and Spearman correlation | 724 | 724 | 0 | 0 | 0 |
| Simple linear regression | 906 | 906 | 0 | 0 | 0 |
| Multiple linear regression | 855 | 835 | 3 | 6 | 11 |
| Logistic regression | 294 | 294 | 0 | 0 | 0 |
| Poisson regression | 309 | 309 | 0 | 0 | 0 |
| Survival | |||||
| Kaplan-Meier and log-rank | 859 | 859 | 0 | 0 | 0 |
| Cox regression | 560 | 560 | 0 | 0 | 0 |
| Dose-response | |||||
| Four-parameter logistic fit | 150 | 139 | 11 | 0 | 0 |
| All 23 analyses | 18,141 | 17,063 | 688 | 379 | 11 |
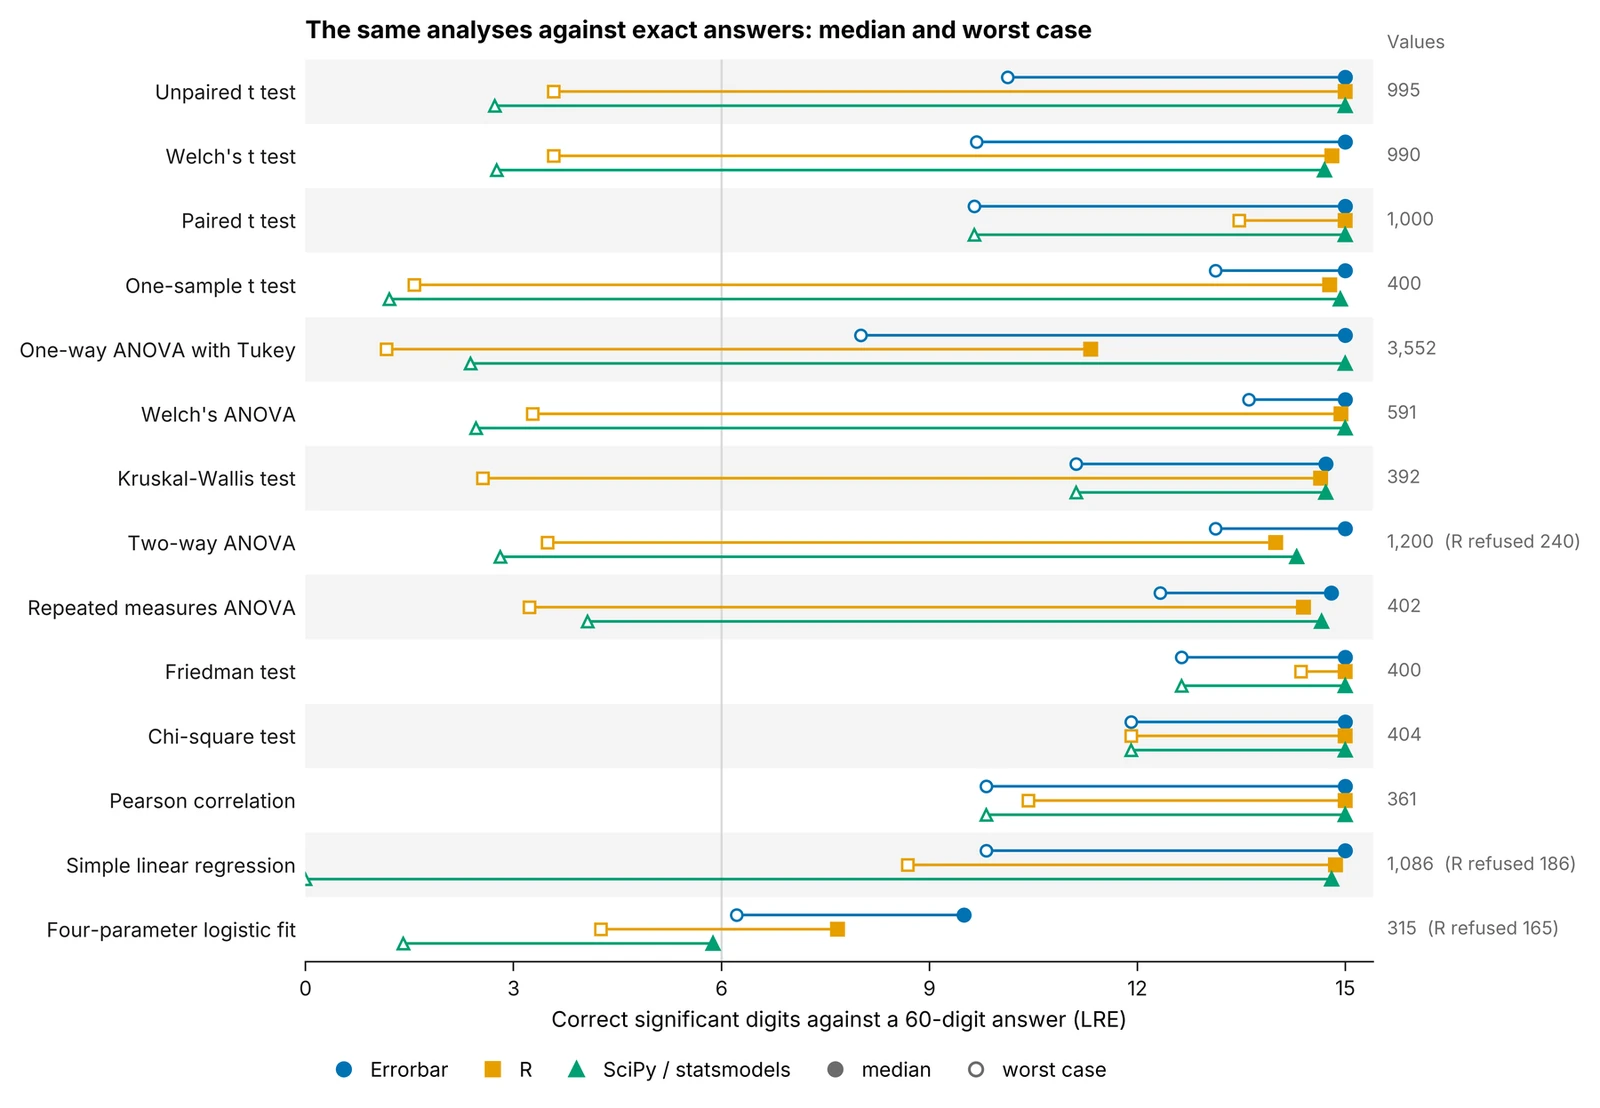
Against exact answers (Figure 3), Errorbar’s median was 15 digits for 11 of the 14 analyses that have them, and at least 14.7 for two more. Its worst case was at least 8.0 digits in every analysis except the four-parameter logistic fit (median 9.5, worst 6.2), where the fitted parameters of a nonlinear model are themselves loosely determined by the data. R’s and SciPy’s worst cases were lower in most analyses, usually on the stress problems with large constant offsets.
4. NIST certified data
The NIST Statistical Reference Datasets give certified answers, computed in very high precision, for summary statistics, analysis of variance, linear regression and nonlinear regression at graded levels of difficulty [6]. They are the usual way to report a statistics program’s accuracy [1, 2].
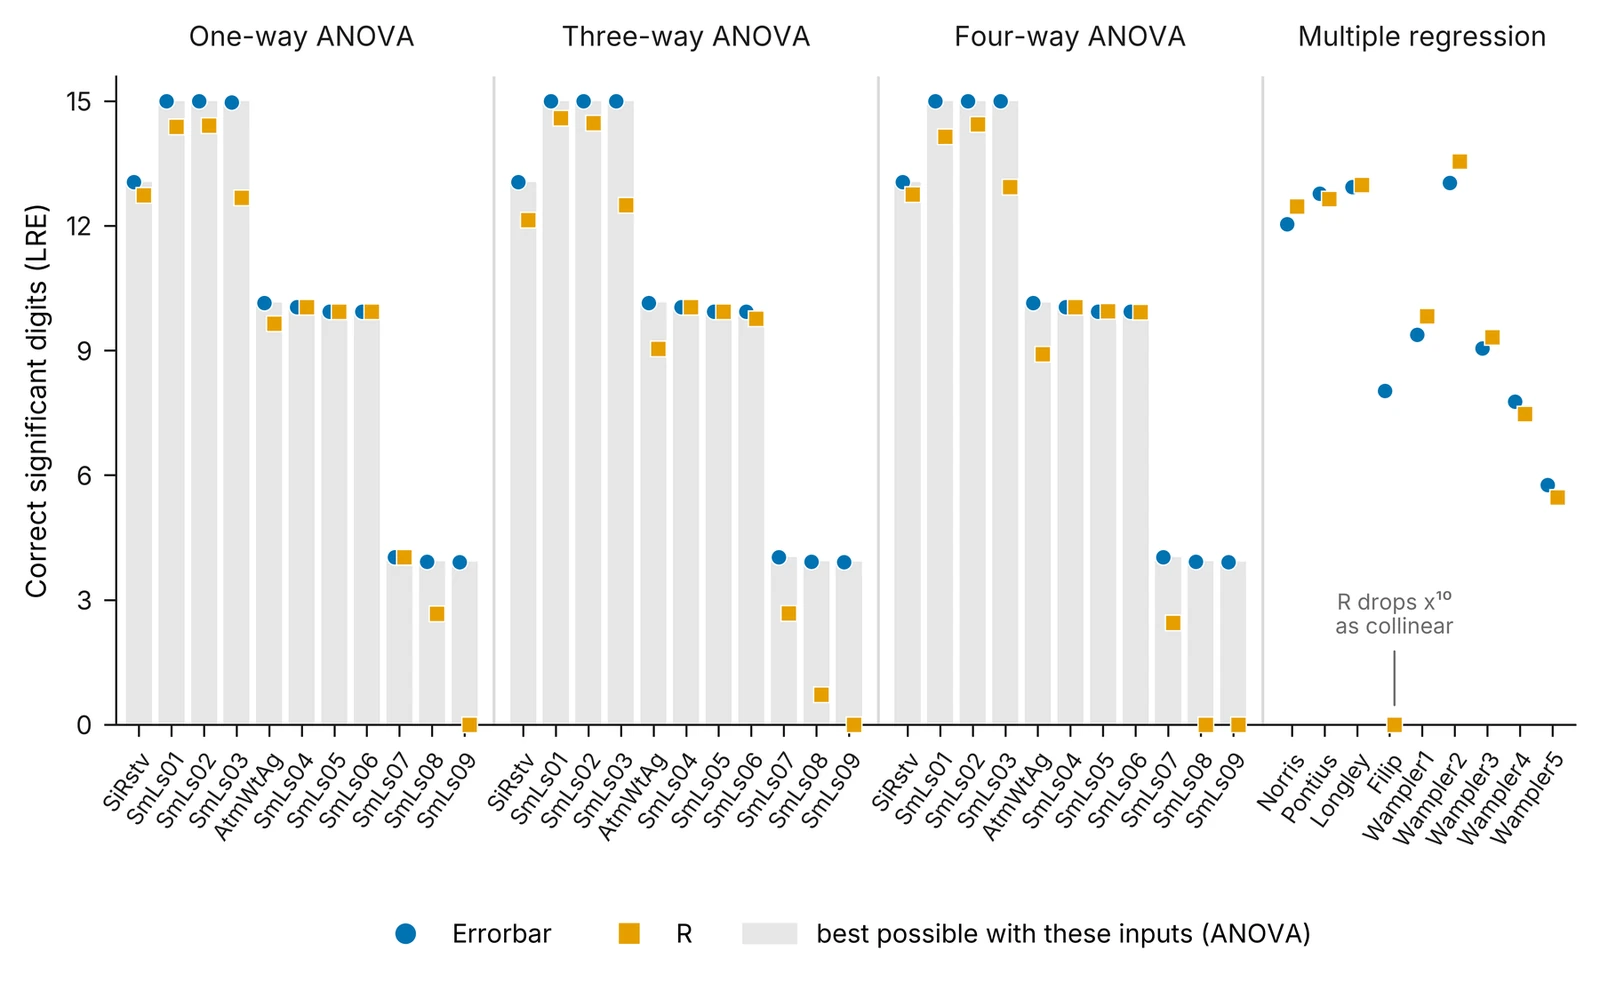
Figure 4 places every dataset we ran (108 dataset and analysis pairs) by the fewest correct digits each program achieved on it. Errorbar had more correct digits than R on 84, the same within 0.05 digits on 19, and fewer on 5. Those five are multiple-regression datasets (Pontius, Wampler1, 2, 4 and 5), by 0.07 to 0.67 digits. On the one-way ANOVA datasets SmLs07 to SmLs09, whose values cannot be stored exactly as binary numbers, Errorbar’s answers equal the exact answers for the data as stored (3.9 to 4.0 digits of the certified values); R’s fewest correct digits were 4.0, 2.7 and 0.
Nonlinear regression
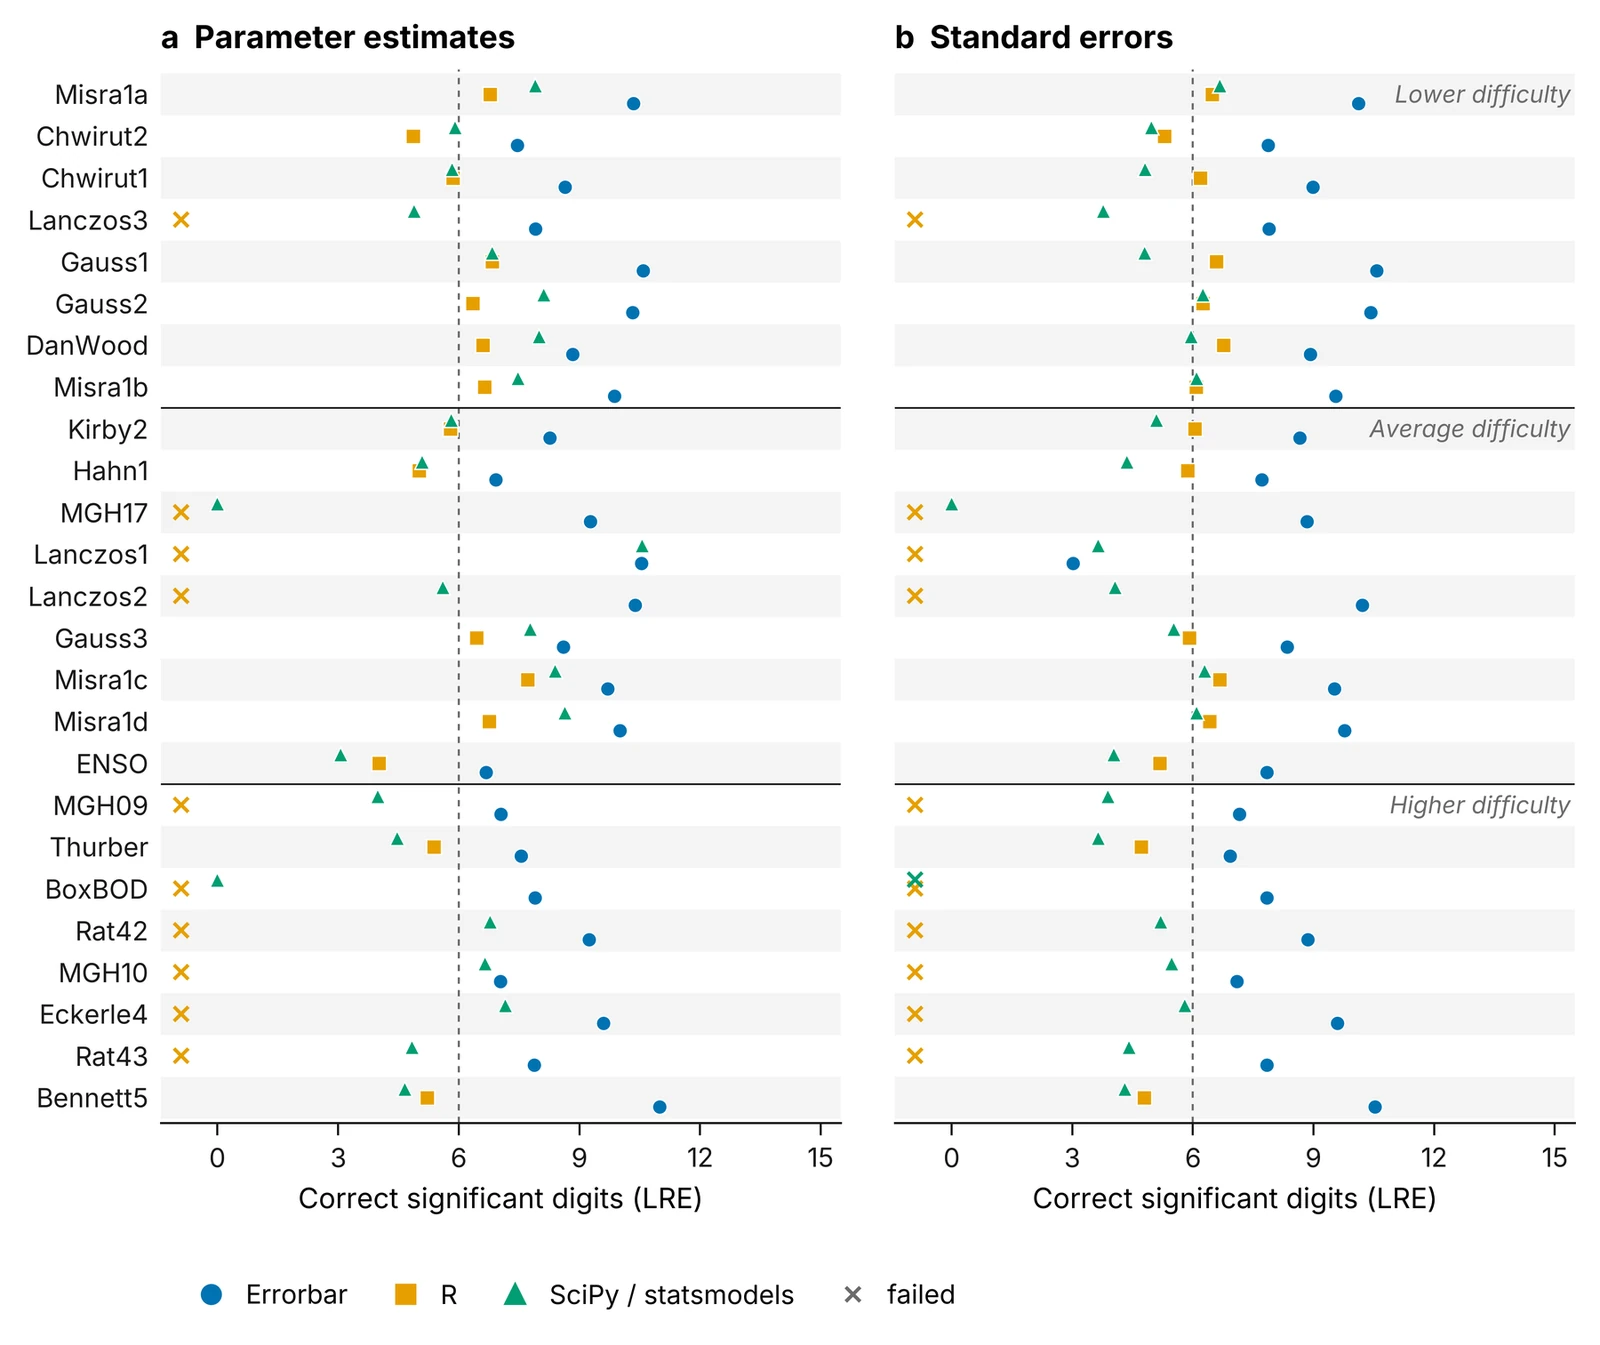
The 25 nonlinear problems are the hardest test of a curve-fitting routine (Figure 5). From both certified starting points, Errorbar’s estimates reached at least 6.7 correct digits on all 25. R’s nls, with default settings, returned no answer on 10 problems from the first start and 2 from the second, and SciPy reached six digits on 15 and 13. Errorbar also chooses starting values itself when the user gives none; from its own starts it reached the certified answer on 24 of the 25, all but ENSO.
ANOVA with more factors, and multiple regression
Figure 6 extends the ANOVA datasets to three- and four-factor designs (made by crossing the one-way data with extra factors, which leaves the certified sums of squares unchanged) and adds the multiple-regression datasets, in a separate run from Errorbar’s engine test suite. Errorbar reached the best answer the stored data allow on every ANOVA dataset. In multiple regression the two programs are within about half a digit of each other on every dataset but Filip, where R drops a term and gets no digits right; in this run R was ahead on Norris, Wampler1, Wampler2 and Wampler3, by 0.27 to 0.51 digits.
5. Data that are hard to compute with
Laboratory data often share many leading digits: optical densities on a high baseline, molecular weights, times stored as timestamps. One-pass formulas lose those digits. Figure 7 adds a constant offset to otherwise ordinary data for t tests, ANOVAs, correlation and regression. At an offset of 10⁹ with a spread of 0.01, Errorbar kept at least 9.7 correct digits on every analysis, where R kept 1.6 and SciPy none. Errorbar’s routines avoid the cancellation; in regression, for example, such columns are centred before the fit.
6. The newer analyses
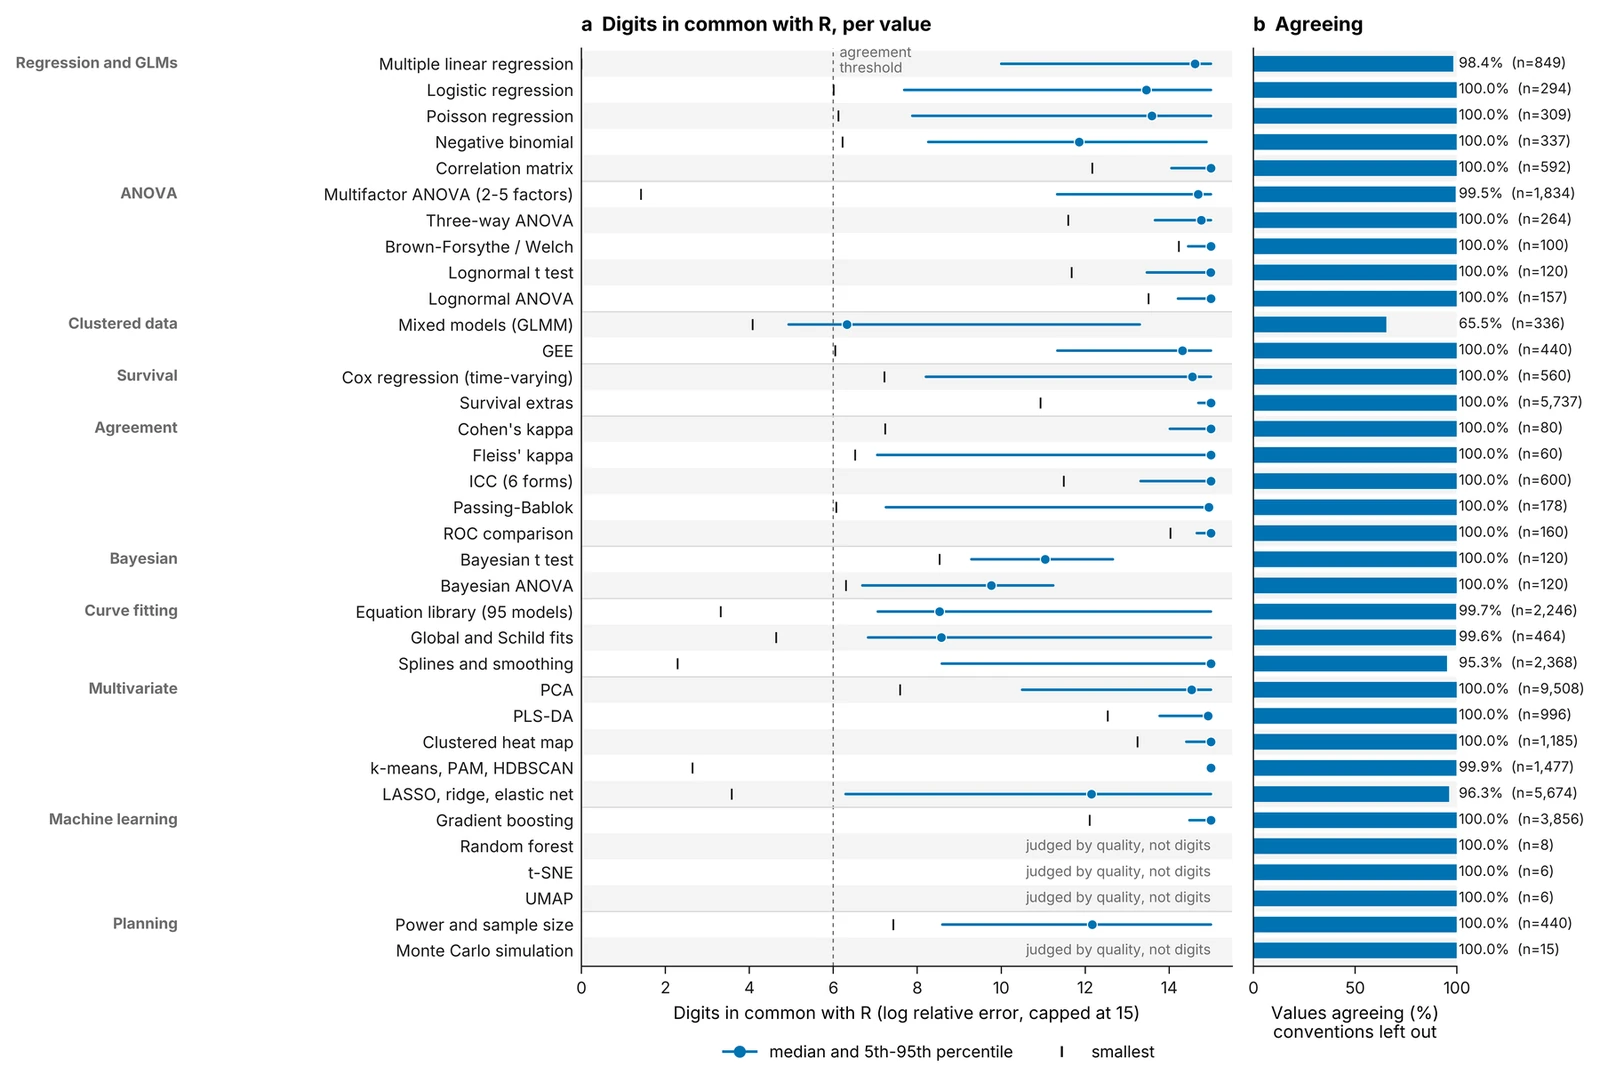
Figure 8 shows the 35 analyses of the second benchmark. Of the 2,490 values that did not agree with R to six digits:
- 2,019 are differences of definition (different published methods, neither wrong). Most (1,949) are HDBSCAN membership probabilities and outlier scores, which Errorbar computes as the method’s original authors do [13, 14] and R’s dbscan package defines differently; the clusters themselves are compared directly. The rest are Passing-Bablok confidence ranks (50), a negative-binomial standard error that R reports from one step before its final estimate (14), and infinite F statistics on exact fits (6).
- 186 are loosely set by the data: both programs reached the same optimum to 12 digits, mostly for variance components of mixed models, which is why mixed models show the lowest agreement in Figure 8.
- 149 are values where R stopped short of the optimum, including all 88 cross-validated errors of penalised regression: in 3,230 fold fits, glmnet’s objective was never lower than Errorbar’s.
- 136 were decided by an exact reference. Errorbar was closer in 122, including every far-tail Tukey P value and every smoothing-spline fit, where R’s smooth.spline reaches 2 to 6 digits. Errorbar was less accurate in the 11 values described in section 7; in the other 3 the two were equally close.
Further checks
- Exported R scripts. Errorbar can export an R script for a result. Run in R, those scripts reproduce all 617 numbers checked, across 84 analysis set-ups, 12 assay and Western blot set-ups, and the formulas of 37 curve models.
- Whole workflows. The checks that notice data entered in a layout that leads to the wrong analysis, and offer a one-click fix, were followed from typed data to every reported statistic: 34 routes and 356 values, all matching R and the NIST one-way ANOVA data.
- Graphs. The numbers graphs draw (bars, error bars, medians, fitted curves, confidence bands) were checked against R and NIST in 1,871 comparisons, all passing.
7. Where Errorbar falls short
These are every result in which Errorbar did worse than a reference, or less well than it could.
- 11 values less accurate than R. All are standard errors and residual standard deviations of NIST’s Wampler1 and Wampler2 polynomials. These polynomials fit their data exactly, so the certified values are zero and both programs return rounding residue. Errorbar’s is at most 2.2 × 10⁻¹⁰, about twice R’s. For responses that reach three million, both are zero for any practical purpose. A fix that removed most of it cost the hardest NIST regression problem up to 0.7 digits, so we kept the original method (section 8).
- A few NIST multiple-regression datasets where R had more correct digits: Pontius, Wampler1, 2, 4 and 5 in the scorecard (Figure 4, by 0.07 to 0.67 digits), and Norris, Wampler1, 2 and 3 in the engine test suite run (Figure 6, by 0.27 to 0.51 digits). The two figures come from separate runs, so their lists differ slightly; both are shown.
- Worst cases on ordinary data. R’s worst case was better than Errorbar’s for the paired t test (13.5 against 9.7 digits), Pearson correlation (10.4 against 9.8) and the Friedman test (14.4 against 12.6). Errorbar’s worst case still exceeds nine digits in all three.
- The four-parameter logistic fit has the lowest worst case of the core analyses, 6.2 correct digits, because its parameters can be loosely determined by the data.
- Automatic starting values for nonlinear fits found the certified answer on 24 of the 25 NIST problems; ENSO needs starting values from the user.
- Lanczos1 standard errors carry three correct digits. The certified standard errors are of order 10⁻¹², and the residuals are rounding noise.
8. Problems found and fixed
The benchmarks found two faults in Errorbar, both fixed before the results above were produced.
- Fisher’s exact test on large tables. On a 3 × 3 table of about 45,000 counts the exact test ran out of memory. It now checks its time and memory budget as it goes and falls back to a Monte Carlo P value.
- k-means. Errorbar took the best of 25 random starts. On one dataset only 9% of starts reach the best clustering, and Errorbar settled on one 0.13% worse than R’s. It now takes the best of 100 starts, each refined by Hartigan’s method [15], at no extra cost because each start is faster. All 120 k-means values now agree with R or, in one case, find a better clustering than R.
One fault was in the benchmark itself: NIST’s starting values were passed to Errorbar in the wrong order for 12 nonlinear problems, which made those fits look failed. We also tried to remove the Wampler residue by refining the least-squares solution with exactly summed residuals. It gained up to half a digit there but lost up to 0.7 digits on NIST’s Filip problem, the most ill-conditioned dataset, so the change was not kept.
9. What this report does not show
- Accuracy is not appropriateness. These results show that Errorbar computes the chosen test correctly, not that the test suits the experiment. Choosing the right analysis matters more, which is why the layout checks were tested end to end.
- Agreement is not proof. Two programs can share a mistake, and R is sometimes the less accurate. That is why every claim about accuracy rests on certified or exact answers, not on agreement alone.
- Default settings. R and SciPy were run with their defaults, as most people run them. With tuned settings, R’s nls converges on more of the NIST nonlinear problems.
- Our own problems. Apart from the NIST datasets, the problems were generated by us with fixed seeds. An independent set of problems, or replication by another group, would strengthen these results.
- Double precision. Every result is bounded at about 15 digits, and some NIST values cannot be stored exactly, so on those datasets the fewest correct digits measures the data as much as the software.
- One point in time. The results describe Errorbar as of 26 October 2026. Any change to the statistics code means running the benchmarks again, and this report will be updated when they are.
10. Versions, data and citation
Errorbar ran under Pyodide 0.27.7 with NumPy 2.0.2, SciPy 1.14.1, statsmodels 0.14.4 and pandas 2.2.3 in headless Chromium. References came from R 4.3.3, SciPy 1.14.1, statsmodels 0.14.4, mpmath 1.3.0 and the NIST Statistical Reference Datasets. The benchmark harnesses, the generated problems with their seeds, the reference outputs and the scored results are kept with Errorbar’s source, and are available on request to reviewers and to labs evaluating Errorbar.
To cite this report:
Telestara. How accurate is Errorbar? Technical report on numerical accuracy against R, SciPy and the NIST Statistical Reference Datasets. Version 1.0, 27 October 2026. https://telestarabio.com/errorbar/accuracy/
References
- McCullough BD. Assessing the reliability of statistical software: Part I. The American Statistician. 1998;52(4):358–366.
- McCullough BD. Assessing the reliability of statistical software: Part II. The American Statistician. 1999;53(2):149–159.
- Altman M, Gill J, McDonald MP. Numerical Issues in Statistical Computing for the Social Scientist. Wiley; 2004.
- Keeling KB, Pavur RJ. A comparative study of the reliability of nine statistical software packages. Computational Statistics & Data Analysis. 2007;51(8):3811–3831.
- Almiron MG, Lopes B, Oliveira ALC, Medeiros AC, Frery AC. On the numerical accuracy of spreadsheets. Journal of Statistical Software. 2010;34(4):1–29.
- National Institute of Standards and Technology. Statistical Reference Datasets. https://www.itl.nist.gov/div898/strd/
- Harris CR, Millman KJ, van der Walt SJ, et al. Array programming with NumPy. Nature. 2020;585:357–362.
- Virtanen P, Gommers R, Oliphant TE, et al. SciPy 1.0: fundamental algorithms for scientific computing in Python. Nature Methods. 2020;17:261–272.
- Seabold S, Perktold J. statsmodels: econometric and statistical modeling with Python. Proceedings of the 9th Python in Science Conference; 2010:92–96.
- Pyodide contributors. Pyodide: Python with the scientific stack, compiled to WebAssembly. Version 0.27.7. https://pyodide.org
- R Core Team. R: A Language and Environment for Statistical Computing, version 4.3.3. R Foundation for Statistical Computing; 2024.
- Johansson F, et al. mpmath: a Python library for arbitrary-precision floating-point arithmetic, version 1.3.0; 2023. https://mpmath.org
- Campello RJGB, Moulavi D, Sander J. Density-based clustering based on hierarchical density estimates. In: Advances in Knowledge Discovery and Data Mining (PAKDD 2013). Springer; 2013:160–172.
- McInnes L, Healy J, Astels S. hdbscan: hierarchical density based clustering. Journal of Open Source Software. 2017;2(11):205.
- Hartigan JA, Wong MA. Algorithm AS 136: a k-means clustering algorithm. Journal of the Royal Statistical Society, Series C. 1979;28(1):100–108.